
Procurement teams sourcing silicone oil in volume have run into the same wall repeatedly over the past few years — spot prices swinging 15–30% within a single quarter, lead times stretching from the usual 3–4 weeks out to 10 or more when upstream silicon metal supply tightens, and specification sheets that don’t always match what arrives at the dock. Get your supply chain positioning wrong here and the downstream effects are real: personal care batches failing viscosity checks, transformer fluid top-ups delayed, textile finishing lines sitting idle. The financial exposure compounds fast once you factor in expedited freight and reformulation costs.
The global silicone oil market was valued at roughly USD 2.1–2.4 billion in 2023 and is projected to reach USD 3.5–4.0 billion by 2032, growing at a CAGR of approximately 5.5–6.2% depending on regional industrial output and specialty-grade demand. Asia-Pacific accounts for 45–50% of global consumption, with polydimethylsiloxane (PDMS) representing over 60% of total volume, particularly in the 50–1000 cSt viscosity range used across industrial, personal care, and electrical applications.
What makes this market harder to read than the headline figures suggest is the way it fractures by grade and region — a 100 cSt commodity PDMS bought out of eastern China behaves like a completely different market from a high-purity 350 cSt fluid sourced for medical-device lubrication in Europe or North America. The growth story is real, but it isn’t uniform, and the risks and opportunities are buried in those distinctions.

Silicone Oil Product Grades and Viscosity Segments That Define Market Revenue
PDMS — polydimethylsiloxane, to use the full name almost nobody in procurement actually says — is the backbone of this market. It accounts for somewhere above 60% of total volume, and in revenue terms it punches close to that same weight, though the exact share shifts depending on how much high-value specialty product is moving in a given quarter. The other three commercially significant categories are methyl phenyl silicone oil, hydrogen silicone oil (also called methyl hydrogen silicone fluid or SiH-fluid depending on your supplier’s datasheet), and amino-functional silicone oil. Each occupies a distinct niche, and conflating them in a procurement spec is the kind of mistake that costs you a rejected batch and a two-week lead-time penalty.
Methyl phenyl grades typically represent somewhere in the 10–15% revenue range. They command a price premium — often 2× to 3× the equivalent PDMS viscosity grade — because phenyl substitution raises the refractive index and dramatically extends the useful temperature window, down toward –60 °C and up past 250 °C in some formulations. Optical encapsulants and high-temperature lubrication are where they earn that premium. Amino-functional silicone oils, used heavily in textile softeners and hair-care conditioners, probably sit around 8–12% of revenue; they are higher value per kilogram than standard PDMS but produced in lower absolute volumes. Hydrogen silicone oil is smaller still by volume but strategically outsize — it is a key reactive intermediate, and I’ll come back to that.
How Viscosity Grade Drives Both Price and Application Suitability
Viscosity is not just a physical property; it is essentially the product’s ticket to a specific end-use, and the pricing follows accordingly. A rough working table:
| Viscosity Range | Typical Price Premium vs. Baseline | Common End-Use |
|---|---|---|
| 5–20 cSt (ultra-low) | +15–30% | Antifoam concentrates, release agents |
| 50–200 cSt (low) | Baseline | Cosmetics emollients, textile softeners, polishes |
| 350–1,000 cSt (medium) | Baseline to +10% | Hydraulic dampers, transformer fluids, mold release |
| 5,000–60,000 cSt (high) | +20–50% | Electrical insulation, shock absorbers, personal care actives |
| 100,000–1,000,000 cSt (very high / HCR range) | +60–120% | Sealant bases, high-consistency rubber compounding |
Price depends heavily on order volume, purity grade, and regional supply — these are directional, not contract figures.
The 50–200 cSt segment is the fastest-growing slice right now, running at roughly 7–8% CAGR by most credible estimates. Low-viscosity PDMS spreads easily on skin and textile fiber, leaves no heavy residue, and is stable enough to survive most formulation conditions. Cosmetics formulators particularly like the 100 cSt grade as an emollient carrier — it has displaced mineral oil in a surprising number of SKUs over the past decade. Textile mills in South and Southeast Asia have been switching softener baths from fatty-acid-based chemistry to low-vis PDMS blends, partly for hand-feel performance and partly because the silicone-treated fabric handles downstream printing steps better.
Hydrogen Silicone Oil: Small Volume, Large Downstream Leverage
Hydrogen silicone fluid — typically 25–60 cSt, Si–H content anywhere from 0.1% to 1.6% by weight depending on application — does not show up as a large revenue line by itself. What it does is enable most of the platinum-catalyzed addition-cure chemistry that underlies silicone elastomers, coatings, and release liners. Demand for it is therefore not independent; it tracks silicone elastomer and release paper production fairly closely. When automotive or electronics production volumes soften, you see it in SiH-fluid orders within a quarter or two. Procurement teams buying this material should watch Si–H content tightly — a drop of even 0.05% below spec can throw off crosslink density in a compounding operation and generate scrap runs that take days to diagnose.
Purity Tiers Within the Same Viscosity Bracket
This is where procurement managers often leave money on the table, in both directions. A 350 cSt PDMS can carry three or four different price points depending on specification: standard industrial grade, food-contact grade (typically requiring compliance with FDA 21 CFR 172.888 or EU equivalent), pharmaceutical grade (USP or EP monograph, with full documentation), and electronic grade (ultra-low ionic contamination, often sub-5 ppm metals). The price delta between industrial and pharma-grade at the same viscosity can run 40–80%, and between industrial and electronic-grade it can exceed 100% for certain critical specifications.
Pharma-grade and electronic-grade silicone oils carry significantly higher prices than industrial-grade material at identical viscosityTrue
Purity specifications for pharmaceutical (USP/EP compliance) and electronic grades require tighter manufacturing controls, additional testing, and full traceability documentation — all of which add real cost. Price premiums of 40–100%+ versus industrial grade are consistent with supplier pricing structures across major producers.
The practical implication: if your formulation does not actually require pharma-grade documentation, buying it anyway is waste. Conversely, if you are running a topical pharmaceutical emulsion and sourcing to an industrial spec to save 30%, you are building a compliance liability. Get the purity tier right at the specification stage, not after audit.
Regional Market Shares: Asia-Pacific Dominance Versus Growth Opportunities in North America and Europe
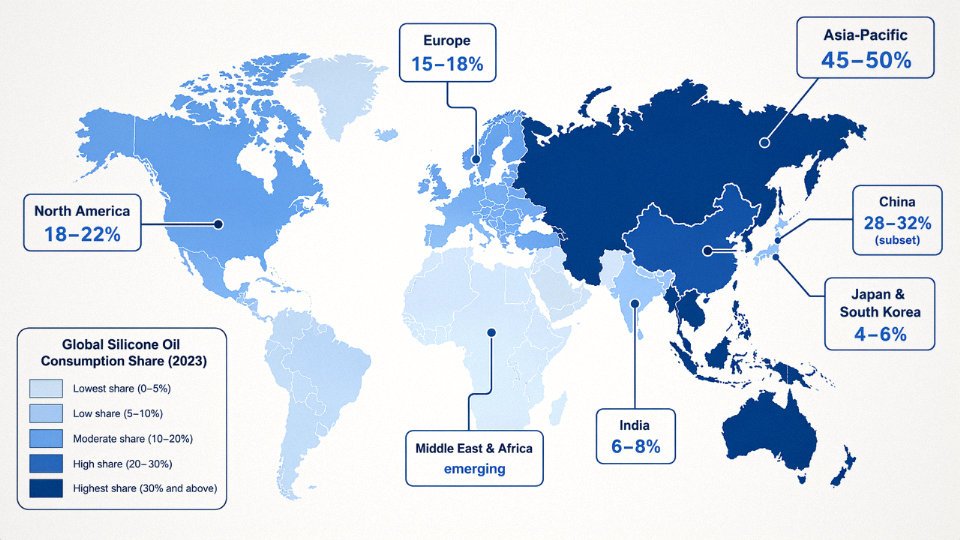
Asia-Pacific is not just the largest consuming region — it is the structural center of gravity for the entire silicone oil supply chain, accounting for roughly 45–50% of global consumption by volume. That figure shifts depending on whether you weight it by mass or revenue, because the region skews heavily toward commodity viscosity grades where price per kilogram is far lower than the specialty products dominating Western markets.
China’s Outsized Role — Consumer and Exporter Simultaneously
China alone represents somewhere around 28–32% of global silicone oil demand, a number that varies year to year with construction activity, textile output, and the personal care manufacturing cycle. Most of that volume is PDMS in the 100–500 cSt range, consumed domestically by release coating lines, textile softener formulators, and transformer oil blenders. What makes China’s position unusual — and genuinely disruptive to global pricing — is that it is simultaneously the world’s largest exporter of commodity-grade silicone oil. Overcapacity built during 2018–2021, combined with feedstock advantages in methyl chloride, means Chinese producers can land product in Southeast Asian and East African markets at prices that local or European-sourced material simply cannot match. For a procurement manager sourcing release agents in Vietnam or a lubricant blender in Kenya, that creates real optionality, though quality consistency at the lowest price tiers is not always reliable — viscosity drift batch-to-batch is a known issue with some commodity-grade Chinese supply.
India sits at roughly 6–8% of global volume, growing faster than the regional average, pulled by personal care manufacturing (silicone emulsions for shampoo and conditioner), agrochemical adjuvants, and a steadily expanding automotive parts sector. Japan and South Korea together contribute around 4–6%, but their consumption skews toward higher-purity and functional grades — encapsulants, dielectric fluids, and optical-clarity grades for display manufacturing.
North America: Smaller Volume, Higher Value Per Kilogram
North America holds roughly 18–22% of global revenue despite consuming a smaller proportion by volume. The gap reflects the grade mix. U.S. demand concentrates in medical-device lubrication (USP-grade PDMS with documented extractables testing), aerospace thermal management fluids, and electronics encapsulation — segments where producers like Dow and Momentive can command significant premiums over commodity pricing. A 350 cSt general-release grade might trade at $2.50–3.50/kg CFR; a USP Class VI-cleared medical-grade equivalent from a qualified domestic source can run $8–14/kg or more, depending on lot traceability requirements and order volume.
Qualification cycles in these end markets are long — 12 to 24 months is not unusual for a medical device customer to approve a new silicone oil supplier — which creates natural stickiness and insulates incumbents from commodity import pressure.
Europe’s Regulatory Premium
Europe’s story is largely about REACH and the growing regulatory scrutiny of cyclic siloxanes, particularly D4 and D5. Formulators in personal care and industrial lubricants are increasingly required to demonstrate compliance with low-cyclic-siloxane specifications, which pushes them toward higher-purity grades and reliable CoA documentation. That raises landed cost for importers, especially those sourcing from regions where analytical testing infrastructure is less standardized. European buyers willing to absorb that cost premium tend to lock in supply agreements with Wacker (Germany) or Elkem (Norway) for exactly this reason — not brand loyalty, but documentation reliability.
REACH restrictions on D4 and D5 cyclic siloxanes have increased formulation costs for European silicone oil buyersTrue
EU REACH regulation restricts D4 and D5 in wash-off cosmetic products above 0.1% concentration, and ongoing regulatory review extends pressure to industrial applications, driving reformulation and higher-purity sourcing costs.
Middle East and Africa: Emerging Production, Not Just Consumption
The Middle East is quietly building out silicone oil production capacity, leveraging proximity to methanol and chlorine feedstocks tied to existing petrochemical infrastructure. Saudi Arabia and the UAE have seen capacity announcements from both global majors and local JVs — the logic being straightforward: serve domestic refinery and industrial demand without import dependency, then use geographic position to re-export into Africa and South Asia. Africa itself remains primarily an import market, heavily price-sensitive, which is exactly why Chinese commodity grades have penetrated so effectively. That dynamic will likely persist for the next five to seven years until regional production matures.
End-Use Industry Demand Analysis: Which Sectors Consume the Most Silicone Oil and Why
Personal care and cosmetics consistently accounts for roughly 22–25% of global silicone oil volume, making it the single largest end-use segment by consumption. The chemistry here is specific: formulators have leaned on PDMS grades in the 5–50 cSt range for skin feel and spreadability, and on cyclopentasiloxane (D5) as a volatile carrier in hair serums and deodorants. The EU’s restriction on cyclic siloxanes in wash-off and, more recently, leave-on products has forced reformulation across dozens of SKUs. In practice, that means substituting D5 with higher-viscosity linear PDMS — typically 10–100 cSt depending on the application — which actually increases demand for PDMS on a weight basis even as total silicone volume per formula stays roughly flat. Procurement teams buying for contract manufacturers in Western Europe are already seeing this shift show up in sourcing specs. The net effect is a mild volume uplift and a more pronounced revenue uplift, since linear PDMS commands a modest premium over D5.
Industrial lubricants and release agents sit at around 20% of global consumption, and this segment is less glamorous but remarkably stable. Mold release applications — rubber, plastics, food-grade silicone parts — consume substantial volumes of 350–1000 cSt PDMS, usually in dilute spray form. Anti-foam agents in food and beverage processing (think brewery fermenters, edible oil refining) use relatively small doses but turn over frequently, creating reliable reorder cycles. Damping fluids in precision instrumentation and rotary dashpot mechanisms tend toward very high viscosity grades, 10,000 cSt and above, at lower volume but with tight specification tolerances. Any supplier substitution in damping fluid applications requires revalidation — that is a real switching cost that keeps incumbents sticky.
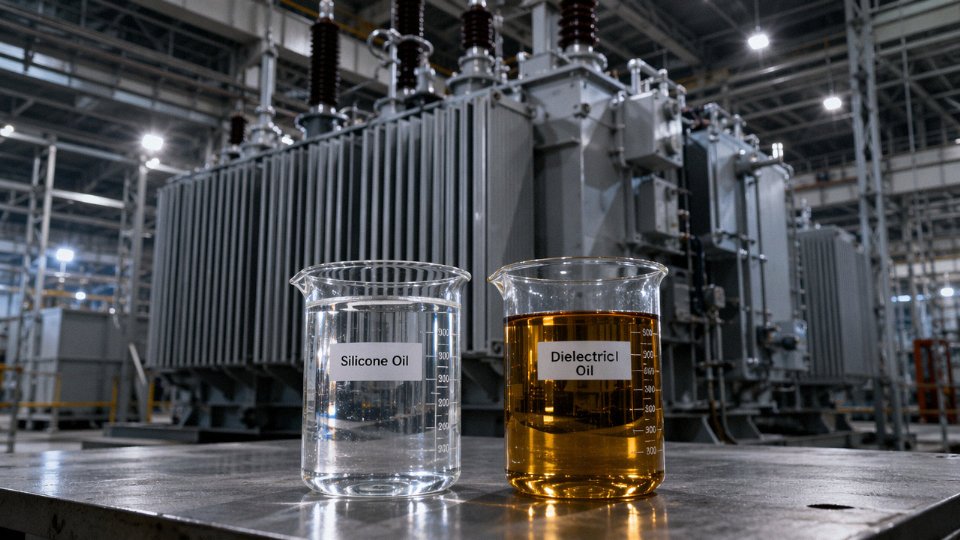
Electrical and electronics demand runs at roughly 15–18% of global volume, and the growth driver has shifted materially in the last three or four years. Traditional transformer dielectric fluid remains a baseline, but thermal interface materials and EV battery thermal management are pulling consumption upward. Silicone-based thermal interface pads and gap fillers for battery module assemblies use PDMS with thermally conductive fillers, so the silicone oil portion is the matrix. As EV production scales, incremental demand here is real and is not fully captured in historical forecasts built on transformer replacement cycles alone.
Silicone oil used in EV battery thermal management must meet stricter ionic purity specs than standard industrial grades.True
Ionic contaminants in dielectric and thermal interface fluids can accelerate battery cell degradation and compromise insulation resistance; EV OEM specifications typically require conductivity below 1 µS/cm and tightly controlled halide content, which standard industrial PDMS grades may not satisfy without additional purification steps.
Textiles and leather together account for about 12% of consumption. Amino-functional and hydroxyl-functional silicone oils are the workhorses here — they bond to fiber surfaces and provide softness, handle improvement, and durable water repellency. Seasonal demand swings are real: finishing mills running autumn/winter fabric production tend to pull harder on amino silicone emulsions in Q2 and Q3.
Medical and pharmaceutical is the smallest segment by volume at 8–10%, but it carries the highest projected growth rate, somewhere around 7–7.5% CAGR. Syringe barrel lubrication is high-purity, low-viscosity PDMS (typically 1000 cSt, USP-grade), and volumes are modest but extremely specification-sensitive. Implantable coatings and drug delivery carrier fluids are where regulatory pressure concentrates — FDA and EMA scrutiny on extractables and leachables makes supplier qualification a multi-year process. You do not switch silicone oil suppliers in a medical device application lightly.
Construction and automotive together represent a diffuse but meaningful slice. Silicone oil as a plasticizer in sealant formulations is a mature, price-sensitive application. Brake fluid additives are a niche. The incremental opportunity worth watching is thermal management fluids for EV powertrains and charging infrastructure, where analysts estimate an additional USD 200–300 million in addressable silicone fluid demand by 2030, depending heavily on how quickly liquid-cooled battery architectures displace air-cooled designs.
Competitive Landscape: Market Share, Capacity, and Strategic Moves of Leading Silicone Oil Producers
The silicone oil supply chain is concentrated at the top and increasingly crowded at the commodity end — a combination that makes pricing dynamics genuinely uncomfortable for mid-tier Western producers right now.
The Integrated Majors and Their Position
Dow, Wacker Chemie, Shin-Etsu Chemical, Momentive Performance Materials, and Elkem Silicones collectively account for somewhere in the range of 55–65% of global silicone fluid revenue, though the exact share shifts depending on how you count captive consumption versus merchant market sales. Dow’s silicone fluids business sits within a broader silicones division that reportedly contributes USD 4–5 billion annually across all product lines; separating out PDMS fluids specifically is difficult from public filings, but industry estimates put their silicone oil revenue contribution at roughly 12–16% of global market value. Wacker and Shin-Etsu are in a similar bracket. Momentive — which has changed hands more than once over the past decade, which matters when you’re evaluating their long-term capital commitment — occupies a somewhat smaller slice, with a stronger emphasis on specialty grades and functional fluids rather than commodity PDMS. Elkem Silicones, following its acquisition of Bluestar Silicones and its Norwegian silicon metal heritage, has a genuinely unusual vertical structure: upstream silicon metal production feeding directly into downstream silicone fluid manufacturing. That integration is a real cost lever.
Vertical integration is probably the single biggest structural advantage in this industry right now. Producers who control silicon metal and chlorosilane synthesis — the two key upstream steps before you get to PDMS polymerization — carry an estimated cost advantage of USD 0.30–0.60/kg over toll manufacturers or formulators buying intermediates on the open market. On a commodity 350 cSt PDMS that’s currently trading at USD 2.80–3.20/kg spot, that margin buffer is not academic. It’s the difference between acceptable margins and genuinely losing money on volume contracts.
Chinese Producers and the Price Reset
Between 2021 and 2023, commodity PDMS spot prices dropped from roughly USD 4.50/kg down to the USD 2.80–3.20/kg range — a fall of around 35–40% depending on grade and region. The primary driver was Chinese capacity expansion running well ahead of demand recovery post-COVID.
Chinese domestic PDMS producers drove commodity silicone oil prices down by an estimated 15–20% between 2021 and 2023True
Multiple industry reports and procurement data from the 2021–2023 period confirm significant PDMS price deflation attributable to Chinese capacity additions from producers including Hoshine Silicon Industry, Wynca Group, and Jiangxi Bluestar Xinghuo Silicones, though the exact percentage varies by grade and contract structure
Hoshine Silicon Industry, Wynca Group, and Jiangxi Bluestar Xinghuo Silicones are the names that procurement teams in Europe and North America have been watching closely — not because they’re buying from them directly in all cases, but because their output sets the floor price. Hoshine in particular has aggressive upstream integration in silicon metal, which gives them a cost structure that’s genuinely hard for Western producers to match on standard industrial grades. For procurement managers buying 200 cSt or 350 cSt PDMS in volume, this has created real leverage in supplier negotiations — but it’s also pushed some Western distributors into a tough spot on inventory valuations.
Capacity Expansions That Signal Long-Term Confidence
Wacker Chemie’s roughly EUR 100 million expansion at its Burghausen site in Bavaria is notable because Burghausen is already one of the most integrated silicone production complexes in Europe. Adding capacity there, rather than greenfielding somewhere cheaper, says something about where Wacker sees defensible margin — high-purity grades, specialty functional fluids, pharmaceutical and electronics applications where customers aren’t simply buying on price per kilogram. Shin-Etsu’s capacity additions in Thailand follow a similar logic: proximity to Southeast Asian demand growth, lower operating costs than Japan, and a hedge against supply chain disruption. Both moves suggest the major integrated players are deliberately pulling away from direct commodity competition with Chinese producers rather than trying to fight that battle on cost alone.
For buyers, the practical implication is a bifurcating supply market — commodity PDMS increasingly sourced from Asia on price, specialty and high-spec grades still flowing from integrated Western or Japanese producers who can hold tighter quality tolerances and offer more consistent technical support. That’s not necessarily a problem, but it does mean your approved vendor list and your qualification process need to reflect two different procurement strategies depending on the application.
Silicone Oil Pricing Trends, Raw Material Costs, and Margin Dynamics from 2020 to 2024
The 2021 price spike in PDMS still gets referenced in procurement circles as a case study in how quickly silicone oil can go from a stable, almost boring commodity to a supply-chain emergency. The short version: hydropower curtailments in Yunnan Province — which produces a substantial share of China’s silicon metal through electricity-intensive smelting — collided with a global freight market that had already lost its mind. Silicon metal spot prices roughly doubled within a few quarters. Combine that with chloromethane feedstock tightness and the knock-on from the global energy crisis hitting European producers simultaneously, and standard PDMS 350 cSt briefly crossed USD 5.00/kg on spot markets, a level most buyers in 2019 would have dismissed as implausible. Some long-term contract holders were partially insulated; spot buyers, particularly smaller formulators in Southeast Asia, absorbed the full hit.
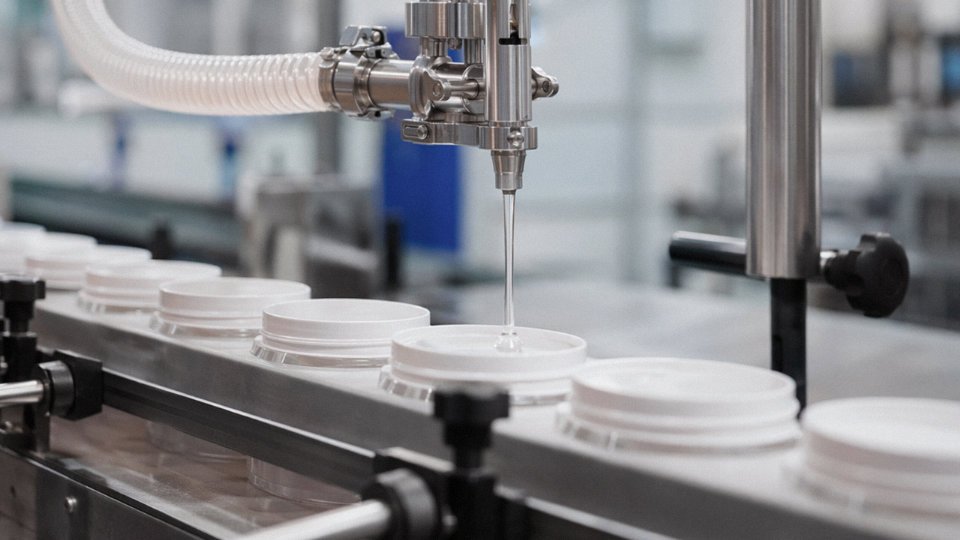
PDMS 350 cSt spot prices briefly exceeded USD 5.00/kg in 2021 due to silicon metal shortages linked to energy curtailments in Yunnan Province, China.True
Yunnan Province enforces periodic hydropower-based electricity rationing that directly curtails silicon metal smelting output; this well-documented 2021 event coincided with global freight disruptions and drove significant upstream cost inflation across the silicone value chain.
The 2022–2023 Correction and Where Prices Settled
The correction was faster than most analysts predicted. Chinese producers — who had been investing in capacity through the late 2010s — brought additional PDMS output online through 2022 and into 2023, and demand from two of the biggest consumption sectors, construction sealants and consumer electronics, softened noticeably as interest rates climbed globally and device replacement cycles stretched out. By mid-2023, standard industrial grades (100–1000 cSt range) had pulled back to roughly USD 2.80–3.50/kg depending on volume, grade, and origin. Chinese-origin material generally landed at the lower end; European or Japanese-origin product, often preferred for tighter viscosity specification or pharma compliance, held closer to the upper bound.
Cost Structure: Where the Money Actually Goes
Understanding the margin dynamics starts with the cost stack. Silicon metal sits at roughly 35% of total production cost for a standard PDMS grade — which is why Yunnan power policy has global pricing implications. Methanol and chloromethane feedstocks together account for around 20%, though this ratio shifts with natural gas and coal prices since chloromethane synthesis routes differ by producer. Energy is around 18% of conversion cost, which makes Chinese producers unusually exposed to provincial power pricing and European producers unusually exposed to gas markets (as 2022 demonstrated painfully). Conversion, depreciation, and overhead fill out the remaining 27% or so.
Margins for integrated producers who control silicon metal supply tend to run 15–25% EBITDA at normalized pricing; pure converters without upstream integration often work on 8–14%, and those numbers compress fast when feedstock spikes aren’t immediately passed through on contract-priced volumes.
Spot vs. Contract Pricing in Practice
Most serious buyers negotiate annual or multi-year supply agreements, and the standard practice is to price long-term contracts 8–12% above prevailing spot at the time of negotiation. That premium sounds counterintuitive — you’d expect a volume commitment to get you a discount — but the supplier logic is straightforward: they’re selling you price certainty and guaranteed allocation, which has real value when the market tightens. In practice, savvy procurement teams index contracts to a silicon metal benchmark with a quarterly price adjustment clause rather than locking a flat price, which distributes the feedstock risk more fairly between buyer and seller.
Outlook for 2024–2026
Standard industrial grades are expected to stabilize in the USD 3.00–3.80/kg range through 2026, assuming no repeat of the hydropower curtailment scenario and continued, if slower, capacity additions from Chinese producers. Specialty grades — pharma-grade PDMS, electronic-grade fluid for thermal management applications — typically carry a 2.5–4× premium over commodity pricing, depending heavily on purity specifications, documentation requirements, and whether the supplier holds the necessary regulatory certifications. Those premiums have proven durable even through the commodity correction, because the qualification barriers to switching suppliers in those segments are genuinely high.
Regulatory Environment and Sustainability Pressures Reshaping Silicone Oil Formulations
The silicone oil market doesn’t exist in a regulatory vacuum, and anyone still treating compliance as a downstream problem is going to get caught flat-footed — either with unsellable inventory or a reformulation crisis on a six-month deadline.
EU Cyclic Siloxane Restrictions: D4, D5, and the Coming D6 Pressure
The most concrete regulatory shock to date was the EU’s restriction on D4 (octamethylcyclotetrasiloxane) and D5 (decamethylcyclopentasiloxane) in wash-off personal care products, which took effect in January 2020 under REACH Annex XVII. Concentration limits were set at 0.1% w/w — tight enough to effectively eliminate their use in rinse-off shampoos, conditioners, and body washes. The knock-on reformulation demand is real and measurable: industry estimates put the displaced volume at roughly 15,000 MT/year globally, most of it replaced by higher-viscosity linear PDMS grades or alternative silicone blends that don’t carry the same persistence profile in aquatic environments.
D6 (dodecamethylcyclohexasiloxane) is the next target. The European Chemicals Agency has been building its dossier, and most compliance teams I’ve spoken with are treating D6 restriction as a matter of when, not if. If you’re formulating leave-on products that rely on D6 for spreadability or film formation, the time to start qualifying alternatives is now — not after the restriction notice lands.
REACH SVHC Listing and Industrial Spillover
D4’s inclusion on the SVHC candidate list creates complications well beyond cosmetics. Industrial lubricant formulators and metalworking fluid manufacturers operating in Europe face increased REACH communication obligations whenever D4 content in a product exceeds 0.1% by weight in articles. In practice, this means revised Safety Data Sheets, updated supply chain disclosures, and — depending on how enforcement develops — potential authorization requirements that could restrict D4 use in certain industrial applications entirely. Suppliers who rely on cyclic siloxane-heavy base fluids for metalworking emulsions should be auditing their formulations now, because the authorization pathway under REACH is slow, expensive, and not guaranteed.
D4 is already fully banned in all industrial applications across the EUFalse
As of 2024, the EU restriction covers wash-off cosmetics specifically. D4 is on the SVHC list and faces communication/authorization obligations in articles, but a blanket industrial ban is not yet in force. Regulatory scope may expand, but treating the current restriction as a total industrial prohibition misrepresents the actual regulatory position.
California’s Safer Consumer Products Program
California’s Safer Consumer Products regulations operate on a different statutory basis than REACH, but the practical effect — for any brand selling into both markets — is additive. The California Department of Toxic Substances Control has flagged cyclic siloxanes as candidate chemicals under the program. Companies reformulating for EU compliance often find that the same product specification satisfies the California disclosure and alternatives-assessment requirements, which is one reason the market impact tends to be analyzed globally rather than jurisdiction by jurisdiction. A brand shipping a single rinse-off product SKU into both the EU and California has very little commercial incentive to maintain a separate high-cyclic formulation for other markets.
Biodegradability: What the Data Actually Shows
PDMS’s environmental fate is more defensible than critics sometimes suggest. In aerobic soil environments, PDMS degrades — slowly — to silica, CO2, and water. The problem is aquatic systems: degradation in water-saturated sediments is significantly slower, and regulators at ECHA and the US EPA are pressing for updated aquatic toxicity datasets that older dossiers simply don’t cover. This is an active area. Expect tighter data requirements on any new PDMS formulation intended for applications where aquatic pathway exposure is plausible — textile finishing, agricultural adjuvants, some paper coatings.
The Low-Cyclic Premium Product Response
The industry has responded with product lines specifically engineered to low-cyclic or cyclic-free specifications. Wacker’s BELSIL grades and Dow’s EL series are the most referenced in formulator discussions — both position ultra-low cyclic content as a compliance feature rather than a performance compromise. The price premium over standard PDMS grades runs roughly 8–15% depending on viscosity and volume, and the aggregate incremental revenue this premium category represents is estimated at USD 150–200 million annually across the industry, though that figure varies with crude silicone feedstock costs and how aggressively producers invest in fractional distillation capacity to hit the specification.
China’s MEE Order No. 12 and GB Standard Evolution
China’s regulatory picture is moving faster than many global suppliers expect. The Ministry of Ecology and Environment’s Order No. 12 — the New Chemical Substance Notification regulations that came into force in January 2021 — imposes a tiered registration system for new chemical substances imported or manufactured in China above certain volume thresholds. For silicone oil formulators introducing modified or novel PDMS variants into the Chinese market, the simplified notification pathway applies only below 100 kg/year per substance; anything above that requires a standard notification with ecotoxicology and environmental fate data. The GB standard updates from SAC (Standardization Administration of China) have been tightening specification language on silicone oil grades used in food contact and pharmaceutical applications, which affects both domestic producers and importers trying to maintain unified global product lines. In practice, the administrative burden of dual compliance — EU REACH plus MEE Order No. 12 — is pushing some mid-sized specialty formulators to regionalize their product portfolios rather than maintain a single global specification.
Market Forecast to 2032: Volume, Revenue, and Segment Growth Projections by Scenario
Any single-number forecast for a specialty chemical market is, frankly, a fiction. The honest answer is a range conditioned on two or three plausible futures. Here is how the silicone oil market looks across those scenarios, built from the demand-side signals that actually move volume — EV battery systems, pharmaceutical manufacturing, and Asian personal care — rather than top-down extrapolation.
Base Case: Steady Compounding on Proven Demand Drivers
The base case assumes silicone oil revenue grows from roughly USD 2.3 billion in 2023 to approximately USD 3.6 billion by 2032, implying a CAGR in the 5.5–5.9% range. That figure depends heavily on two things holding: continued EV production ramp in China, Europe, and North America requiring dielectric and thermal interface fluids, and sustained demand from pharmaceutical contract manufacturers who have largely standardized on PDMS as a processing aid and lubricant for elastomeric stoppers. Neither is guaranteed, but both have multi-year procurement commitments behind them — which makes them more reliable than, say, personal care volume forecasts.
On the volume side, the base case puts total global silicone oil consumption somewhere between 680,000 and 750,000 MT by 2032. Asia-Pacific absorbs roughly 55% of that incremental growth, mostly through Chinese industrial demand and Indian personal care and textile processing expansion. Give or take 30,000–40,000 MT depending on how fast Indian specialty chemical infrastructure matures — that country’s silicone downstream capability is still catching up to its raw material ambitions.
Bull Case: EV Acceleration and Southeast Asian Industrialization
At 6.5–6.8% CAGR, the bull case reaches roughly USD 4.0–4.1 billion by 2032. The driver here is not some optimistic macro assumption — it is a specific technical shift. Immersion cooling architectures for EV battery packs and high-density server farms both require low-viscosity dielectric fluids, and PDMS in the 5–50 cSt range is currently the most mature candidate. If immersion-cooled battery modules reach even 15–20% of new EV pack designs by 2030, that sub-segment alone pulls meaningful incremental volume.
The secondary bull-case driver is Southeast Asian industrialization absorbing Chinese commodity-grade silicone oil that currently has nowhere to go. Vietnam, Thailand, and Indonesia are building out textile and personal care manufacturing capacity quickly enough that some of the Chinese overcapacity pressure reverses into regional trade flow rather than price collapse.
Bear Case: Overcapacity, Regulation, and Substitution
At a 4.0–4.2% CAGR, the bear case lands near USD 3.1 billion by 2032. Chinese silicone producers added substantial polydimethylsiloxane capacity between 2020 and 2023, and if domestic demand softens with China’s property and construction sector still depressed, export pricing pressure continues to compress margins globally and discourages capacity additions elsewhere. That dynamic is not speculative — it is already visible in spot price data from 2022–2024.
Regulatory pressure on cyclic siloxanes (D4, D5, D6) in rinse-off cosmetics has already crimped some European personal care demand, and further classification under REACH or equivalent frameworks could push formulators toward vegetable-derived emollients — dimethicone alternatives based on meadowfoam or caprylic/capric triglycerides are commercially available and technically adequate for a meaningful subset of applications. Synthetic PAO lubricants represent a more credible substitution threat in industrial textile softeners than most silicone suppliers publicly acknowledge.
Vegetable-derived emollients are a direct drop-in replacement for PDMS in all personal care formulationsFalse
Bio-based alternatives match PDMS performance in some emollient applications but cannot replicate the thermal stability, spreading coefficient, or dielectric properties required in most industrial, pharmaceutical, and EV thermal management uses. Substitution risk is real but narrowly concentrated in rinse-off cosmetics.
Highest-Conviction Sub-Segment Bets
Three niches stand out regardless of which macro scenario plays out. EV thermal interface fluids — primarily low-viscosity PDMS compounds and silicone gels used in battery thermal management systems — are growing at roughly 12–14% annually, a figure that holds even in a slower EV ramp because thermal management is non-negotiable for battery longevity. Pharmaceutical-grade PDMS, driven by injectables manufacturing and medical device lubrication, is tracking 7–8% CAGR; the barrier here is not demand but qualification time, which actually protects incumbents. High-refractive-index phenyl silicone oils for LED encapsulants are the least-discussed but arguably the cleanest growth story — 9–11% CAGR, tight supply of qualifying grades, and no obvious substitute that survives 150 °C junction temperatures over a 50,000-hour LED lifetime.
The honest caveat: none of these sub-segment CAGRs are independent of base resin pricing. If methanol and silicon metal costs stay elevated, downstream specialty grades get squeezed whether demand holds or not.
Supply Chain Architecture: Feedstock Sourcing, Production Hubs, and Logistics Cost Benchmarks
The silicone oil supply chain is longer and more geographically concentrated than most procurement managers realize until something breaks. Trace it back far enough and you end up in open-pit quartz mines — primarily in China, Brazil, and Norway — where high-purity silicon dioxide ore feeds electric arc furnaces to produce silicon metal. From there, the chain runs through chlorosilane synthesis, hydrolysis, cyclization, and finally ring-opening polymerization to yield PDMS. Each step adds capital intensity and geographic lock-in.
How the Value Chain Actually Stacks Up
Quartz ore is relatively abundant, but metallurgical-grade silicon metal production is not. It’s energy-hungry — smelting requires roughly 11–13 MWh per metric ton of silicon metal, which is why production gravitates toward regions with cheap hydroelectric or coal power. China currently accounts for around 70% of global silicon metal output, and within China, Yunnan and Xinjiang provinces together hold close to 60% of that capacity. Yunnan relies on hydropower; Xinjiang on coal. Both have been subject to government power rationing at various points — Yunnan faced dry-season hydro curtailments, Xinjiang has seen policy-driven production limits — and each event pushes silicon metal spot prices up by 15–35% within weeks, depending on inventory buffers across the chain.
Downstream of silicon metal, producers react it with methyl chloride to synthesize methylchlorosilanes, primarily dimethyldichlorosilane (Me₂SiCl₂). Hydrolysis yields cyclic siloxanes — D3, D4, D5 — which are then ring-opened and polymerized under acid or base catalysis to produce PDMS at target viscosities. The chemistry is well understood, but the capital cost of a fully integrated chlorosilane plant is substantial enough that very few companies have built greenfield capacity outside China, Germany, and the United States in the past two decades.
Delivered Cost Benchmarks and the Tariff Distortion
For a procurement manager buying, say, 500 cSt PDMS in volume, the landed cost picture today looks roughly like this: Chinese-produced material delivered to a European port runs USD 3.40–3.90/kg, depending on freight rates (which have swung wildly since 2020), the specific tariff classification, and whether the buyer is absorbing REACH registration costs or the supplier is. European domestic production of an equivalent grade sits at USD 4.20–4.80/kg — the gap is real, though it narrows for specialty or high-purity grades where European producers have qualification advantages.
The 25% US Section 301 tariff on Chinese silicone products, which has been in place since 2018, effectively priced Chinese commodity PDMS out of direct US market competition for most applications. What actually happened — and this is visible in trade flow data — is that Chinese export volumes redirected toward Southeast Asia, South America, and the Middle East. Some of that material then flows into formulated products that re-enter Western markets, which creates compliance headaches for buyers who need to certify origin for tariff preference programs.
The 25% Section 301 tariff applies to silicone oils imported directly from China into the United StatesTrue
Silicone oils including PDMS fall under HTS codes subject to the Section 301 tariffs imposed by USTR starting in 2018, which remain in force and directly affect landed cost calculations for US importers sourcing from Chinese producers.
Lead Times, Dual-Sourcing, and the Nearshoring Shift
Spot orders from Chinese producers typically run 4–8 weeks to a European or US warehouse, assuming no port congestion and standard documentation. Buyers with 90-day rolling contracts can usually get that down to 2–3 weeks. Domestic European or US specialty grades take 3–5 weeks, but that assumes qualification is already complete — first-time qualification for a pharmaceutical or food-contact grade can add 8–16 weeks of testing and paperwork on top.
Several European formulators I’m aware of have moved to a structured dual-source model: Chinese commodity supply for high-volume standard viscosity grades (50–350 cSt PDMS), and a European or US producer for anything requiring tighter specs, traceability documentation, or proximity to just-in-time production schedules. It’s not always cheaper, but when a Xinjiang power curtailment or a Red Sea freight spike hits, the ones with domestic backup don’t shut a production line down. The ones running single-source lean procurement sometimes do. That lesson tends to stick.
Frequently Asked Questions About the Global Silicone Oil Market
What is the current global silicone oil market size?
The market was valued at roughly USD 2.1–2.4 billion in 2023, depending on how you draw the boundary — some figures include functional silicone fluids blended into formulations, while others count only neat PDMS sold as a discrete product. By 2032, projections generally land in the USD 3.5–4.0 billion range, implying a CAGR somewhere between 5.5% and 6.2%. That growth rate is not spectacular, but silicone oil is a mature specialty chemical, not a venture-stage material. Sustained demand from EV thermal management and injectable medical devices is what keeps the upper end of the forecast credible.
Which country produces the most silicone oil?
China, by a wide margin. Domestic PDMS production capacity sits at roughly 55–60% of the global total, concentrated in producers like Hoshine Silicon Industry, Wynca Group, and Bluestar Xinghuo. The upstream advantage is real: China controls a substantial share of silicon metal output, which means integrated players there carry a structural cost advantage over Western formulators buying intermediates on the open market. That said, quality consistency across Chinese commodity-grade product still varies more than buyers sometimes expect — viscosity tolerance and volatile-content specs are worth specifying tightly on any import purchase order.
What is the difference between silicone oil and silicone fluid?
Functionally, nothing. “Silicone fluid” is the preferred term in INCI nomenclature and formal technical documentation; “silicone oil” is what everyone on the plant floor actually says. Both refer to linear or lightly branched PDMS-based polymers that stay liquid at room temperature. The distinction occasionally matters in regulatory filings or cosmetic ingredient labeling, but for procurement and formulation work, treat them as synonyms.
Is silicone oil banned in the EU?
No.
PDMS (polydimethylsiloxane) is banned in the EU for industrial and personal care useFalse
The EU has restricted cyclic siloxanes D4, D5, and D6 in rinse-off cosmetics above threshold concentrations, but linear PDMS grades are fully permitted across industrial, medical, food-contact, and personal care applications under current EU regulations.
The confusion stems from restrictions on cyclic siloxanes — specifically D4, D5, and D6 — in rinse-off cosmetic products, which have been in force since 2020. If your formulation uses cyclomethicone or a blend containing these cyclic species above the regulated threshold, you have a compliance problem. Linear PDMS at 350 cSt or 1000 cSt in a leave-on lotion, a transformer fluid, or a mold-release agent? Fully permitted.
What is the price of silicone oil per kilogram in 2024?
Standard industrial-grade PDMS at 350 cSt has been trading in roughly the USD 2.80–3.50/kg range on spot markets through much of 2024, though that shifts with methanol and silicon metal feedstock costs and with how aggressively Chinese producers are running capacity. Pharmaceutical-grade and electronic-grade material — tighter volatile specs, lower metal ion content, batch traceability — runs closer to USD 7–14/kg depending on specification stringency and order volume. Buying 20-tonne ISO tank lots versus 200 kg drums also meaningfully affects your landed cost; the freight math alone can swing delivered price by 15–20% on smaller parcels.
What industries use the most silicone oil?
Personal care and cosmetics absorbs roughly 22–25% of global volume — hair serums, skin emollients, and color cosmetics all lean heavily on PDMS. Industrial lubricants and release agents account for around 20%, and electrical/electronics applications (transformer oils, encapsulants, thermal interface materials) take another 15–18%. Together those three sectors account for well over half of all consumption. Medical devices, food processing, and textile finishing split the remainder, each meaningful but smaller individually.
What will drive silicone oil demand over the next decade?
Electric vehicle thermal management is the most discussed growth lever right now, and the volume projections are credible — battery cooling loops and power electronics increasingly specify silicone-based dielectric fluids because they tolerate the temperature cycling that synthetic hydrocarbons struggle with. Expansion of injectable and implantable medical devices, particularly in aging markets in Europe and Northeast Asia, requires pharmaceutical-grade PDMS for syringe lubrication and device coatings. And premium personal care manufacturing in India, Southeast Asia, and South Korea continues to shift toward silicone-rich formulations as consumer expectations rise. None of these trends is a straight line, but all three are structural rather than cyclical.