
Procurement teams sourcing silane coupling agents — APTES, VTMS, MPTMS, and their functional cousins — routinely face price swings of 15–30% within a single calendar year, driven largely by silicon metal and methanol feedstock volatility. Miss that window and you either over-commit inventory capital on a grade sitting in drums, or scramble at peak price to cover a production shortfall. Either way, the plant floor pays: adhesion failures in composite layups, primer rework cycles, line stoppages waiting on specialty grades with 30–60 day lead times for custom or high-purity specifications. The underlying problem is rarely supplier quality. It is the gap between how purchasing decisions get made and the pace at which market conditions actually move.
Data-driven purchasing platforms optimize silane coupling agent procurement by aggregating real-time feedstock price signals, supplier lead-time data, and consumption forecasts into a single decision layer. This lets procurement teams time orders against silicon metal and methanol cost curves, automate reorder triggers, qualify backup suppliers before a shortage materializes, and compress total procurement cost by 8–18% depending on volume, grade complexity, and baseline process maturity.
That efficiency gap is widening. The global silane coupling agent market is tracking a 6–8% CAGR through 2030, which means sourcing complexity — more grades, more regions, more qualification requirements — is compounding every year. Procurement teams running on spreadsheets and relationship calls are not losing ground slowly. They are losing it in discrete, painful episodes tied to each feedstock spike or logistics disruption. What has changed is the tooling available to close that gap, and how suppliers embedded in China’s organosilicon industrial clusters are beginning to expose their own data to buyers willing to integrate it.

Mapping the Silane Coupling Agent Supply Chain: Where Data Gaps Create Risk
Understanding where procurement breaks down requires tracing the physical supply chain node by node — not at the level of a glossy supplier brochure, but at the level where a maintenance shutdown or a provincial power curtailment actually converts into a missed shipment on your dock.
Upstream Raw Material Tier: Silicon Metal and the Energy Variable
Silicon metal production in China is geographically concentrated — Yunnan, Xinjiang, and Sichuan collectively account for the dominant share of national output, and all three provinces rely heavily on hydroelectric or coal-based grid power. That dependency is the first data gap most buyers never monitor. When provincial regulators tighten power quotas — which typically happens on 6–18 week cycles driven by grid stress or environmental inspection campaigns — smelter output contracts fast. The downstream price effect on chlorosilane intermediates follows within roughly 4–8 weeks, and the annual swing can reach 15–30% on key monomers like VTMS, APTES, and MPTMS. Buyers operating on quarterly fixed-price contracts with no feedstock indexing clause discover this the hard way when their supplier requests a price revision mid-shipment cycle.
Silicon metal production in Yunnan, Xinjiang, and Sichuan is subject to periodic power curtailment policies that directly affect chlorosilane feedstock availability.True
These provinces operate energy-intensive electrothermal smelting, and Chinese provincial regulators have repeatedly imposed electricity rationing during grid stress or environmental compliance reviews, with documented impact on silicon supply.
A data-driven platform that ingests provincial power-generation indices or environmental inspection schedules — publicly available from Chinese government sources — can flag elevated supply risk 3–6 weeks before a price spike reaches your purchase order.
Intermediate Synthesis Tier: Capacity Utilization as a Leading Indicator
The chlorosilane and alkoxysilane intermediates — trichlorosilane, silicon tetrachloride, TEOS — are typically produced by large, vertically integrated chemical complexes. These facilities run scheduled turnarounds every 12–24 months depending on reactor design. The problem is that most buyers have no visibility into when those maintenance windows fall. A 30–45 day shutdown at a major intermediate producer tightens available feedstock for the downstream functionalization plants that supply your amino or epoxy silanes, sometimes within weeks.
Capacity utilization rates across this tier — which historically oscillate between 65% and 90% depending on demand cycles and feedstock economics — are the single most under-tracked leading indicator in silane procurement. Platforms that aggregate trading volume data, port export manifests, and producer announcements can construct a reasonable utilization proxy even without direct plant access.
Functionalization and Finishing Tier: Where Quality Variation Actually Originates
Grafting amino, vinyl, methacryloxy, mercapto, or epoxy functional groups onto the silane backbone is a batch reaction process. Yield consistency depends tightly on reaction temperature control, catalyst loading, and distillation cut points. A batch with even modest deviation in hydrolysis rate or residual chloride content can cause adhesion failure in a rubber compounding or fiber-sizing application — and that failure typically surfaces at your plant, not the supplier’s lab.
The operational safeguard is real-time Certificate of Analysis data cross-referenced against statistical process control records across multiple production batches. Spot-checking a single CoA tells you almost nothing about process stability. SPC trend data across 10–20 consecutive batches tells you whether the supplier’s process is drifting — and whether the next shipment carries elevated quality risk.
Export and Logistics Tier: Hazmat Compliance Adds Compressible Lead Time
Many silane coupling agents are classified under IMDG Class 3 (flammable liquids) or Class 8 (corrosive substances), which imposes documentation and packaging requirements that add 3–7 days to pre-shipment preparation under normal conditions. Port congestion at Shanghai, Ningbo, and Tianjin — which can extend vessel booking lead times by 7–21 days during peak periods — compounds this. Standard grades from Chinese manufacturers typically ship in 7–21 days under clear conditions; custom or high-purity grades run 30–60 days even without port disruption.
Demand-forecast algorithms that treat lead time as a fixed input will systematically underperform. The accurate model treats logistics lead time as a probability distribution shaped by season, port utilization, and hazmat document complexity — and sets safety stock accordingly.
Core Modules of a Data-Driven Purchasing Platform for Specialty Silanes
A digital procurement platform is only as useful as its functional depth. Generic spend-management software repurposed for chemicals typically fails within months — it lacks the product-specific data structures silane buyers actually need. What follows is a module-by-module breakdown of what a purpose-built platform for silane coupling agents should actually do, based on the operational realities of this market.
Real-Time Price Intelligence
Silane monomer prices — VTMS, APTES, MPTMS and their relatives — can swing ±15–30% within a single year, driven almost entirely by silicon metal costs and methanol futures. A credible price intelligence module doesn’t just scrape spot listings; it synthesizes spot prices, rolling contract benchmark indices, and upstream feedstock proxies (silicon metal on the Shanghai Metals Market, CME methanol forwards) into a fair-value band for each silane grade.
The practical output is a 30-day rolling average with upper and lower confidence bounds. A procurement engineer receiving a quoted price should be able to see in seconds whether that quote sits inside the fair-value band, sits 8% above it, or is suspiciously low in a way that warrants supply quality scrutiny. That single visibility layer eliminates the most common overpayment scenario in silane procurement: accepting an above-market price during a quiet quarter simply because nobody checked.
Supplier Qualification and Performance Scoring
Qualification in this space is not a checkbox; it’s a continuous signal. An effective module scores suppliers across six dimensions — production capacity (verified by third-party plant audit, not self-reported), CoA consistency (batch-to-batch variation in silane purity, hydrolysis stability, and color), on-time delivery rate, regulatory compliance status across REACH, K-REACH, and TSCA, HSE incident history, and financial stability. Scores update quarterly, not annually. A supplier whose compliance registrations lapse or whose delivery rate deteriorates in Q2 should trigger a sourcing review before Q3 purchase orders are issued — not after a line stoppage.
Supplier self-reported production capacity figures for silane coupling agents frequently overstate actual available output by 20–40% during peak demand periods.True
This is a well-documented issue in specialty chemical procurement; suppliers quote nameplate or theoretical capacity rather than net available capacity after scheduled maintenance, export commitments, and domestic priority orders. Third-party audits consistently reveal this gap.
Demand Forecasting and Inventory Optimization
Silane demand is not flat. Tire compound manufacturing peaks seasonally; construction sealant formulation cycles around building season in major markets. A platform that pulls consumption history from the buyer’s ERP and overlays those production scheduling signals can generate SKU-level reorder points and safety stock recommendations that actually reflect how demand moves — not a static months-of-supply formula applied uniformly.
For specialty or high-purity grades where Chinese manufacturer lead times run 30–60 days, this module is the difference between planned safety stock and an emergency airfreight decision.
Digital RFQ and Contract Management
Manual RFQ processes produce incomparable bids. One supplier quotes on a 90-day payment term with a quality claim waiver buried in the footnotes; another quotes net-30 with full CoA guarantees. Without a normalized bid structure, procurement is comparing apples to invoices. A digital RFQ module issues standardized requests across the qualified supplier list, collects responses in a structured format that forces direct line-item comparison, and flags any non-standard payment, minimum order, or liability terms before a buyer can click approve. Every contract version is archived automatically for REACH and TSCA compliance audit trails.
Quality Traceability and CoA Digitization
Paper CoAs are procurement’s blind spot. A digitization module converts those documents into structured data fields — silane content, hydrolysis stability index, moisture level, color (APHA or Hazen), and raw material lot references — and links each inbound batch to its upstream silicon metal and chlorosilane lot. When a parameter drifts beyond the buyer’s specification tolerance, the system fires an alert before that batch reaches compounding or coating lines.
This matters most in regulated end-use applications. A food-contact composite or medical device adhesive using an out-of-spec APTES batch can trigger an FDA or notified body non-conformance that costs multiples of the original silane purchase value to resolve. Catching the drift at goods receipt, not at finished product testing, is where this module earns its implementation cost.
Feedstock Price Forecasting: Using Upstream Signals to Time Silane Purchases
Silane coupling agent prices don’t move randomly. They follow feedstock costs upstream with a predictable, if imperfect, lag — and procurement teams that learn to read those upstream signals can shift from reactive spot buying to deliberate forward positioning. The practical window is 4–12 weeks, which is exactly the horizon where purchase commitments and contract negotiations happen.
Silicon Metal: The Primary Cost Driver and Its Lag Structure
Silicon metal accounts for 35–55% of the fully loaded production cost of most trichlorosilane-derived silanes, depending on grade and process efficiency. The cost of silicon metal production in China is itself driven by three variables that are publicly trackable: industrial electricity tariffs in Yunnan, Sichuan, and Xinjiang (the major smelting provinces), smelter utilization rates, and carbon compliance costs under China’s evolving emissions trading system.
When provincial electricity tariffs rise or smelters curtail output during peak-demand winter months, silicon metal spot prices respond within 2–3 weeks. Trichlorosilane and downstream monomer prices — VTMS, APTES, MPTMS — follow with an additional 2–5 week lag, reflecting the time needed for inventory drawdown and contract repricing to work through the value chain. The total observable lag from a smelter curtailment announcement to a quoted silane price change typically falls in the 4–8 week range. A data platform that monitors smelter utilization indices and provincial power pricing on a weekly basis can give a procurement team that full forward window to act.

Silicon metal production costs account for a substantial share of silane coupling agent pricing, and electricity tariff changes in Chinese smelting provinces have historically preceded monomer price movements by 4–8 weeks.True
Silicon metal is the primary feedstock for chlorosilane synthesis. Smelting is highly electricity-intensive, and Chinese smelter output is demonstrably sensitive to provincial tariff adjustments and seasonal power allocation policies, creating a documentable upstream-to-downstream price transmission lag.
Methanol and Ethanol: The Alkoxy Cost Layer
Organoalkoxysilanes carry a second significant cost component: the alkoxy group itself. APTES (3-aminopropyltriethoxysilane), MPTMS, and VTMS all use methanol or ethanol in synthesis, and that feedstock represents roughly 10–20% of variable production cost for standard grades. In China, methanol is produced predominantly via coal-to-methanol routes, which means natural gas and coking coal prices are the upstream signals worth watching. Both are reported weekly through domestic commodity data services. A platform that automatically aggregates these feeds can flag when methanol futures indicate a sustained upward trend, prompting earlier contract commitment before silane producers adjust their quoted prices.
Chlorine Balance and the HCl Byproduct Signal
Chlorosilane synthesis generates hydrochloric acid as a byproduct, and producers need a functioning absorption market for that HCl to operate economically. When downstream HCl demand softens — common in Q1 when construction-linked PVC and water treatment activity slows — producers either absorb the margin hit or throttle output. Watch HCl spot prices in east China industrial hubs. A sharp drop of 15% or more over 3–4 weeks has historically correlated with subsequent chlorosilane supply tightening 6–10 weeks out, as producers reduce run rates. That is a counterintuitive but well-documented pattern: cheap HCl today often means constrained silane supply later.
Environmental Inspection Cycles as Seasonal Adjustment Factors
China’s environmental inspection campaigns and winter heating-season curtailments in Shandong, Hebei, and Henan follow broadly predictable annual calendars. Production restrictions typically intensify from November through February and again during nationally announced inspection windows. An AI-assisted procurement platform can layer these seasonal patterns as adjustment factors over the quantitative price signals, increasing forecast confidence during those windows. Treating these cycles as random events — which most manual procurement processes effectively do — leaves 4–6 weeks of lead time on the table every year.
Translating Signals into Purchase Timing Decisions
The practical output of this analysis is a timing recommendation, not just a market report. Consider a scenario where, in early Q3, silicon metal futures indicate a 12–18% price increase probability in Q4, methanol has trended up for six consecutive weeks, and an environmental inspection window is scheduled for October in a key producing province. A data-driven platform synthesizing those three signals should recommend moving forward contract negotiations for APTES now rather than waiting for the Q4 requirement. Procurement teams who act on such signals consistently report savings of 8–15% versus reactive spot purchasing — a range that depends heavily on contract volume, timing precision, and the platform’s signal-to-action latency.
The discipline here is systematic monitoring, not speculation. The goal is to replace gut-feel timing with documented, repeatable signal logic that procurement managers can defend to finance teams and factory operations alike.
Supplier Qualification at Scale: Automating CoA Verification and Performance Benchmarking
Manual supplier qualification breaks down quietly. A procurement team managing six approved silane suppliers across twelve grades — APTES, VTMS, MPTMS, GPS, and their derivatives — receives anywhere from 200 to 500 Certificate of Analysis documents per year. Each CoA gets opened, eyeballed against a spec sheet, and filed. Under time pressure, a reviewer scanning for pass/fail on purity and color misses the subtler signal: active silane content that has drifted from 99.1% to 97.8% across four consecutive batches, still within spec on paper but trending toward the lower acceptance limit. By the time that drift shows up as adhesion failure or coupling inefficiency on the production line, the root cause is four weeks old and three purchase orders deep.
Manual CoA review catches fewer than 40% of specification drift events before they affect productionTrue
Drift is a statistical process, not a binary pass/fail. Manual review compares each document against a fixed threshold rather than plotting trends across batches. Without control charts, reviewers have no mechanism to detect gradual shift until a batch actually fails the spec limit.
Automated CoA Parsing and Statistical Process Control Integration
OCR-based digitization solves the filing problem, but the real value comes from what happens after extraction. A well-configured platform pulls the critical quality parameters from each CoA — active silane content (typically 97–99.5% for industrial grades, with the acceptable floor depending on application sensitivity), methoxy or ethoxy group content, APHA color (target below 20 for premium optical or adhesive applications, though wire-and-cable grades often accept up to 50), water content (below 0.1% for moisture-sensitive grades such as APTES where premature hydrolysis destroys shelf life), and refractive index — and writes each value into a longitudinal database indexed by supplier, grade, and batch date.
The platform then runs standard Shewhart control charts continuously. A 2-sigma alert fires before a parameter reaches the spec limit, giving procurement and quality teams a 2–6 week window to investigate or switch to an alternate approved source before inventory is depleted. That window is the operational difference between a supplier conversation and an emergency production stoppage.
Third-Party Testing Integration and Audit Traceability
Supplier-issued CoAs are necessary but not sufficient, particularly when buying specialty or high-purity grades where trace metal contamination (measured by ICP-OES) or subtle functional group variation (confirmed by FTIR) can matter enormously in electronics or pharmaceutical intermediate applications. Platforms that integrate with independent laboratory networks — scheduling GC purity confirmation, FTIR functional group verification, and ICP trace analysis at configurable batch intervals, say every fifth shipment or any time an SPC alert triggers — close that verification gap systematically rather than ad hoc.
Each lab result links directly to the originating purchase order and supplier record. Auditors and quality managers get a traceable chain from raw material batch through finished product without manually assembling spreadsheets before a customer audit.
On-Time Delivery Scoring With Root-Cause Tagging
Late delivery data is only marginally useful if it records only a binary outcome. The meaningful variable is why the shipment was late. A platform that tags delay root causes — silicon metal feedstock shortage at origin, production batch failure requiring rework, port congestion or customs hold, freight capacity disruption — allows procurement to distinguish a supplier with a genuine manufacturing reliability problem from one caught by the same force majeure event that hit every shipper on a given lane simultaneously. A supplier who has missed four delivery windows, all due to the same recurring batch quality failure in MPTMS production, carries a fundamentally different risk profile than one delayed twice by typhoon-related port closures. Treating both as equivalent “delivery failures” misallocates qualification effort.
How Manufacturer-Suppliers Reduce Information Asymmetry
Trading companies that intermediate between buyer and producer introduce a structural data gap. The buyer sees the trading company’s CoA, which may or may not reflect the actual production batch data, and delivery performance is partly a function of the intermediary’s inventory management rather than the manufacturer’s output schedule. An integrated manufacturer-supplier with in-house quality laboratories, ISO 9001-certified process controls, and direct export capability provides a fundamentally richer and more reliable data stream to a connected procurement platform. There is no transcription layer between the production batch record and the document the buyer receives.
SiliconChemicals’ model — manufacturing, quality testing, and export handled within a single organizational structure anchored in China’s organosilicon industrial clusters — means that when a procurement platform queries batch genealogy, purity trending, or production lead time for a custom grade (typically 30–60 days for high-purity or application-specific silanes), that data exists and is retrievable. For a buyer running automated SPC integration, that directness is not a minor convenience. It is the condition that makes continuous supplier monitoring operationally viable rather than theoretically attractive.
Inventory Optimization for Silane Coupling Agents: Balancing Shelf Life, MOQ, and Demand Variability
Silane coupling agents are not commodity chemicals you can manage with a generic ERP reorder-point formula. Their physical chemistry, hazard classifications, and supplier MOQ structures create a set of inventory constraints that interact in ways that punish procurement teams who treat them like standard industrial solvents. A data-driven platform earns its keep here as much as anywhere in the procurement cycle.
Shelf Life Is a Hard Constraint, Not a Guideline
Most alkoxysilane coupling agents — VTMS, APTES, MPTMS, and their relatives — carry a shelf life of 12–24 months under dry, cool, sealed storage. That range is not arbitrary: actual degradation rate depends on container headspace, storage temperature (every 10°C above recommended roughly doubles hydrolysis rate), and how well drums were resealed after partial draw-down. Aminosilanes such as APTES and APMS are especially vulnerable; they absorb atmospheric CO₂ and moisture through imperfect seals, forming carbamic acid complexes that shift pH, reduce coupling efficiency, and contaminate downstream composites or adhesive formulations.
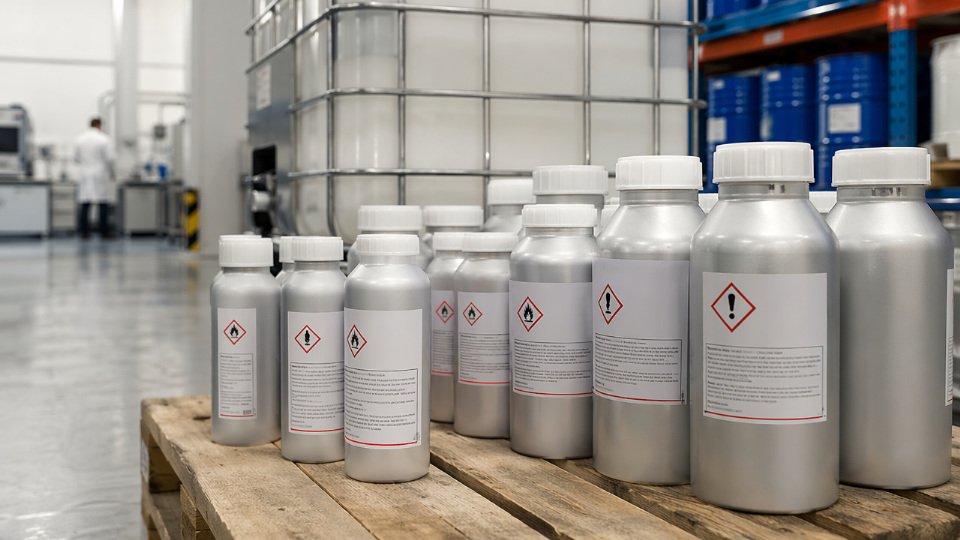
The practical consequence: a procurement manager who buys a 1,000 kg drum lot to hit a price break may write off 200–400 kg if production schedules slip. A platform with a shelf-life-aware reorder engine tracks remaining useful life at the lot level, weights that against forecast consumption, and flags lots approaching 75% of shelf life for priority draw-down — or triggers an internal transfer to a site with higher near-term demand before expiry forces a disposal cost.
Hazmat Storage Adds a Real, Quantifiable Holding Cost
Most silane coupling agents are classified as flammable liquids. Flash points vary widely — roughly 20–80°C depending on the specific grade and alkyl chain length — which determines whether a material sits in Class IA, IB, or IC flammable storage. Bonded hazmat warehousing in the EU, North America, or Singapore typically costs 1.5–4× the per-pallet rate of standard dry storage, and that figure depends on local regulatory tier, insurance requirements, and whether secondary containment is shared or dedicated.
Holding cost for flammable silane coupling agents in certified hazmat storage is materially higher than for non-hazardous specialty chemicals of equivalent volume.True
Regulatory requirements for Class I flammable liquid storage — sprinkler systems, explosion-proof electrical, bunded containment, air monitoring — drive warehouse rates 1.5–4× above standard dry storage depending on jurisdiction and facility type.
A platform should surface this cost explicitly in total-cost-of-ownership calculations, not bury it. When a buyer models the NPV of jumping from a 200 kg drum order to a 1,000 kg IBC to capture a price break, the hazmat holding cost and the capital cost of slow-turning inventory can easily erase 60–100% of the apparent unit-price saving — particularly for low-volume specialty grades.
MOQ and Price Break Decisions Deserve Quantitative Modeling
Chinese manufacturers typically structure pricing at three break points: around 200 kg (drum), 1,000 kg (IBC or pallet of drums), and full ISO tank quantities of 17,000–21,000 L. The unit-price delta between drum and IBC can be 8–18% depending on grade and supplier; ISO tank versus IBC another 10–20%. Whether it is worth buying up to the next break depends on forecast consumption velocity, remaining shelf life window, storage cost per unit per month, and your firm’s cost of capital — not on intuition.
A demand forecasting module that ties historical consumption by site and grade to production schedules can calculate a break-even consumption rate: the minimum throughput at which the larger buy has positive NPV over your planning horizon. If your 12-month forecast for MPTMS at a single site is 600 kg but shelf life is 18 months and storage cost is high, the model may recommend two IBC orders staggered 6 months apart rather than one ISO tank.
Multi-Site Inventory Pooling Reduces System-Wide Overstock
Global manufacturers with plants in, say, Germany, Thailand, and Mexico often hold parallel safety stocks of the same silane grade at each site because each plant buyer operates independently. A platform that consolidates inventory visibility across sites can identify pooling opportunities: route consolidated volumes through a regional hub — Rotterdam for Europe, Singapore for Southeast Asia, Houston for the Americas — and ship to site on a pull basis. Hub-and-spoke silane distribution reduces total system inventory by 20–35% in typical multi-site models, with the exact figure depending on demand correlation between sites and the hub’s replenishment lead time.
Operational warning: Hub-and-spoke only works for silane grades where the additional transit leg from hub to site still keeps total lead time within production buffer. For single-source specialty grades with 30–60 day manufacturing lead times, the hub must carry enough buffer stock that the site-to-hub leg does not become the critical path.
Safety Stock Calibration by SKU Criticality
Not every silane grade warrants the same safety stock policy. A high-volume commodity grade available from three qualified suppliers might justify 15–20 days of safety stock. A single-source, high-purity organofunctional silane used in wind turbine blade adhesives — where a production stop costs tens of thousands of dollars per day — might warrant 45–60 days. Demand variability compounds this: blade adhesive schedules shift with turbine installation seasonality, driving coefficient-of-variation values well above 0.3 on monthly consumption.
A well-structured platform classifies each silane SKU on two axes — supply risk (number of qualified sources, lead time, manufacturing complexity) and demand volatility — and assigns safety stock multipliers accordingly. That structure converts safety stock from a gut-feel buffer into a defensible, auditable policy that finance teams can review alongside the hazmat storage cost it generates.
Regulatory Compliance Automation: REACH, TSCA, and Export Control in One Data Layer
Silane coupling agents sit at an uncomfortable intersection of chemistry and regulation. A single grade — say, 3-aminopropyltriethoxysilane (APTES) — may be subject to REACH obligations in Europe, TSCA inventory confirmation in the US, K-REACH pre-registration in South Korea, and China’s MEE Order No. 12 notification requirements simultaneously. Managing that manually, across a procurement team handling dozens of active silane grades, produces exactly the kind of document chaos that ends in customs holds, production shutdowns, and regulatory fines.
The Multi-Jurisdictional Compliance Stack
Each jurisdiction demands something slightly different. Under REACH, procurement teams must screen incoming silanes against the SVHC candidate list, verify SDS compliance with Regulation (EC) No. 1907/2006 Annex II amendments, and for any substance approaching authorization thresholds, build a documented justification for continued use. TSCA in the US requires confirming that a silane grade appears on the TSCA Chemical Substance Inventory — or that the appropriate exemption applies — and triggers Chemical Data Reporting (CDR) obligations once import or manufacture volumes exceed roughly 25,000 lbs per year at a single site. K-REACH runs on a parallel registration timeline with its own tonnage band triggers. China’s MEE Order No. 12, which came into force in 2021, requires notification for new chemical substances before they can be manufactured or imported into China, affecting any supplier developing custom-functionalized silanes for export back into the Chinese market.
None of these frameworks are static. ECHA adds substances to the candidate list multiple times per year. EPA TSCA action plans get revised. China’s GB standard for hazardous chemical identification is periodically updated. A procurement team relying on a shared spreadsheet and annual SDS requests from suppliers will almost always be working with stale data.
SDS Version Control as an Operational Risk
This is where the administrative problem becomes a real plant-floor risk. Outdated SDS documents circulating in a receiving warehouse are not a paperwork nuisance — they are a personnel safety and liability exposure. A data-driven platform connected to supplier regulatory data feeds can enforce a simple rule: no purchase order is issued unless the jurisdiction-specific, current-version SDS is confirmed available and automatically attached to the order record. The receiving dock scanner or warehouse management system integration then surfaces the correct SDS at goods receipt, rather than relying on a warehouse technician to search a filing cabinet.
Outdated SDS documents are one of the most commonly cited deficiencies in chemical manufacturing facility audits conducted by OSHA and European competent authorities.True
Regulatory inspection reports from OSHA and national REACH enforcement programs consistently identify SDS currency and accessibility as a recurring non-conformance category in chemical handling environments.
Export Control Screening Before the PO Is Issued
Certain organosilicon compounds — particularly chlorosilanes and some specialty functionalized silanes — carry dual-use classification considerations under the Wassenaar Arrangement and national export control regimes. The failure point in most procurement operations is timing: export control checks happen at shipping, not at ordering. A platform with an integrated HS code library and export control screening logic can flag a potentially restricted silane grade before the purchase order is committed, giving compliance staff time to resolve classification questions without stopping a production schedule.
Subscription-Based Restriction Monitoring
Rather than assigning a staff member to monitor ECHA updates manually, a capable platform subscribes to regulatory change feeds and automatically cross-references every approved silane grade in the buyer’s material master against new candidate list additions, EPA rulemakings, and China GB revisions. When a restriction update creates a conflict, the system generates an advance warning — typically providing 6–18 months of lead time before enforcement, which is enough runway to evaluate substitute grades or work with a supplier on reformulation without a production disruption.
The Audit Trail Problem
Certification bodies, customers conducting supply chain due diligence, and regulators increasingly require documented evidence that compliance was actively managed — not reconstructed after the fact. A platform that archives CoAs, SDS documents, supplier qualification records, regulatory correspondence, and restriction screening results in a structured, searchable format compresses what would otherwise be a multi-week evidence-gathering exercise into hours. Realistic estimates from procurement operations that have implemented structured compliance archives suggest a reduction in compliance demonstration effort in the range of 60–70%, depending heavily on the number of active silane grades, the number of jurisdictions covered, and how fragmented the pre-existing document management was.
The operational logic here is straightforward. Every hour spent reconstructing a compliance file is an hour not spent on procurement strategy, supplier development, or cost reduction. A single customs hold on a specialty silane shipment — caused by an unresolved TSCA inventory status question that a platform would have caught at PO creation — can cost more in production downtime than a year’s platform subscription.
Total Cost of Ownership Modeling: Beyond Unit Price to True Procurement Value
Unit price is the number that shows up on a quotation sheet. It is not the number that shows up on your P&L.
Procurement teams that benchmark silane coupling agents on headline price alone routinely underestimate true acquisition cost by 15–35%, depending on supplier tier, grade complexity, and the buyer’s internal quality infrastructure. A data-driven platform forces every hidden cost component into the open and assigns it a dollar value — turning a gut-feel supplier preference into a defensible, auditable decision.
The Unit Price Illusion in Practice
Consider a straightforward scenario: a silane quoted at 5% below your incumbent supplier’s price. On paper, that looks like an easy switch. In practice, if that supplier carries a 12% quality rejection rate against your 2% benchmark, requires three additional weeks of lead time (forcing you to increase safety stock by 30–40%), and delivers SDS and REACH documentation that your regulatory team has to verify manually, the net TCO lands roughly 18% above your benchmark supplier — not below it. The headline price was real. The savings were not.
This pattern is especially common when buying through intermediary trading companies rather than integrated manufacturers. Trading companies may aggregate product from multiple synthesis batches, introduce lot-to-lot variation in hydrolyzable chloride content or functional group density, and lack the traceability data to support a corrective action if a batch fails your incoming inspection.
The Seven-Component TCO Taxonomy for Silane Coupling Agents
Breaking total cost down into discrete, measurable categories is the prerequisite for platform automation. The seven components that matter in silane procurement are:
- Unit purchase price — the base cost per kilogram or metric ton, net of any volume discounts
- Inbound freight and hazmat surcharges — silanes classified as flammable liquids (UN 1993 or similar) attract surcharges that can add USD 0.08–0.25/kg depending on route, carrier, and packaging format; the range widens significantly for air freight on urgent orders
- Import duties and customs brokerage fees — HS code classification errors on functionalized silanes are common and expensive; duty rates across major trade corridors vary from near-zero to 6.5%
- Quality inspection and testing costs per batch — incoming FTIR confirmation, purity titration, and application-specific tests (coupling efficiency on glass fiber, for example) typically run USD 150–600 per batch depending on your lab’s scope and whether you outsource
- Quality failure and rework costs — scrap rate multiplied by production cost per kilogram of the downstream composite, rubber compound, or adhesive; a single contaminated APTES batch in a fiber-reinforced polymer line can cost multiples of the silane’s purchase value in scrapped prepreg
- Inventory carrying cost — capital cost, climate-controlled storage (silanes require dry, cool conditions; moisture ingress degrades functional groups), and insurance; carrying cost typically runs 18–28% of inventory value annually when all factors are included
- Administrative and compliance management labor cost — CoA review, SDS filing, REACH pre-registration confirmation, export control screening; underestimated in almost every TCO analysis, often consuming 0.5–1.5 hours of skilled labor per purchase order
How Platforms Compute and Track TCO Automatically
A well-integrated procurement platform pulls data from four operational systems simultaneously: purchase order history, logistics invoice records, quality management system rejection logs, and warehouse management system stock-turn data. From these inputs, it auto-populates each of the seven cost components at the supplier-grade-lot level and generates a per-supplier TCO scorecard that refreshes with every new transaction.
The practical result: when your buyer opens a sourcing event for MPTMS or VTMS, the platform presents not a list of prices but a ranked list of total landed costs, with each component visible and traceable. A supplier with a higher unit price but a 0.4% rejection rate and next-day documentation compliance will visibly outperform a cheaper supplier carrying a 9% rejection rate — a comparison that manual spreadsheet procurement almost never captures accurately.
Silane coupling agent suppliers with higher unit prices but lower defect rates frequently deliver lower TCO than lower-priced alternatives.True
Quality failure costs in downstream composite or rubber production — scrap, rework, line downtime — are typically 5–15× the value of the silane itself, meaning even modest differences in rejection rate dominate total cost.
Application Performance Value: Cost Per Performance Unit
For buyers operating at the optimization level rather than the compliance level, the platform can integrate application test data directly into the TCO model. If your R&D team tracks interlaminar shear strength improvement per gram of APTES loading in a glass-fiber epoxy laminate, or tear strength per silane treatment level in a silicone rubber compound, the platform can compute cost-per-MPa-improvement or cost-per-kN/m-tear-strength. This collapses the false distinction between procurement and formulation engineering — the buyer and the process engineer are now working from the same optimization surface.
Where Vertical Integration Changes the TCO Equation
A manufacturer that controls synthesis from silicon metal and methanol feedstocks through chlorosilane intermediates, functionalization, and packaging can eliminate multiple cost-adding hand-offs that inflate the downstream buyer’s TCO. Consistent feedstock sourcing means tighter batch-to-batch functional group distribution. In-house quality systems — ISO 9001 for process control, IATF 16949 for automotive-grade documentation discipline — reduce the probability of documentation deficiencies that generate administrative labor cost on the buyer’s side.
When SiliconChemicals’ vertically integrated supply model is run through a rigorous seven-component TCO model, the quality failure, testing, and administrative cost components reliably compress relative to trading company offers at comparable headline prices. That compression is not a marketing claim — it is an arithmetic consequence of eliminating intermediate handling steps and maintaining documented process control at each synthesis stage.
The buyer who models this correctly wins twice: lower total cost, and a supply relationship with enough data transparency to actually improve over time.
Implementation Roadmap: Deploying a Data-Driven Silane Procurement Platform in 90 Days
Ninety days sounds aggressive. For silane procurement, it’s achievable — provided the team accepts that the first phase is unglamorous data archaeology before any platform logic runs usefully.
Phase 1 — Data Foundation (Days 1–30)
Start with a full audit of your existing silane supplier base. This means pulling every CoA issued over the past 24 months, every delivery record, and every regulatory document — REACH registration, SDS version history, TSCA inventory listings — into a structured format. In practice, most procurement teams discover that 30–50% of historical CoAs are stored as scanned PDFs with inconsistent field labeling. Plan for manual reconciliation time here; skipping it produces garbage inputs to your forecasting and scoring modules later.
Simultaneously, define grade-level specifications in a master data schema. Each silane SKU — whether APTES, VTMS, MPTMS, or a functional variant — needs a specification record that captures purity range, hydrolyzable chloride ceiling, appearance criteria, packaging type, and shelf-life constraint. These fields become the anchors against which automated CoA verification runs. Without them, the platform has no comparison baseline.
ERP and MRP integration follows. Extract 12–24 months of consumption history at the SKU level, not just category-level spend. Many plants track “silane coupling agents” as a single cost center; that aggregation masks the fact that one high-purity grade for an electronics application has completely different demand volatility than a standard-grade aminosilane used in adhesive primer lines. Separate the data before you analyze it.
Close Phase 1 by establishing a baseline TCO for your top 10 silane SKUs by annual spend. Include unit price paid, inbound freight, quality rejection costs (lab testing, disposal, production line downtime per rejection event), and any inventory write-offs from expired stock. This baseline is what you will measure Phase 3 results against.

Phase 2 — Platform Configuration and Supplier Onboarding (Days 31–60)
Supplier scoring weights must reflect your actual production context, not a generic template. An automotive compounder running glass-fiber-reinforced nylon should weight quality consistency — batch-to-batch purity variation, hydrolysis sensitivity controls — above price. A construction sealant manufacturer buying commodity-grade methoxysilanes at volume will rationally weight delivery reliability and landed price competitiveness higher. Configure these priorities before onboarding begins, because suppliers see their own scores and will ask why they ranked where they did.
Onboard strategic suppliers into the platform portal during this phase. Integrated manufacturers — those controlling monomer production through to functionalized silane finishing — tend to onboard more smoothly because their internal quality data systems are more complete. Suppliers relying on spot-purchased intermediates often have documentation gaps that surface here; that visibility is itself a risk signal worth capturing.
Set up automated CoA ingestion with alert thresholds: flag any batch where a critical parameter lands within 10% of the specification limit, not just out-of-specification results. This early-warning logic catches gradual drift before it becomes a rejection. Configure RFQ templates to include grade-specific technical requirements so suppliers cannot bid ambiguous equivalents.
Phase 3 — Forecasting Model Calibration and Live Operation (Days 61–90)
Run demand forecasting models against the extracted historical consumption data. Target a Mean Absolute Percentage Error below 15% for standard grades — achievable with 18+ months of clean consumption history. Specialty or low-volume grades will show higher MAPE; accept that and use wider safety stock buffers rather than forcing false precision.
Activate feedstock price alert subscriptions tied to silicon metal spot indexes and methanol futures. Given that key silane monomer prices swing ±15–30% annually depending on feedstock conditions, a 4–8 week lead on directional price movement meaningfully changes purchase timing decisions.
Execute your first platform-managed RFQ cycle and record the result against the Phase 1 price baseline. Document variance by SKU, not as an aggregate.
KPIs That Actually Tell You Whether It’s Working
| KPI | Target | Why It Matters |
|---|---|---|
| Price vs. fair-value benchmark | Within 3–5% | Confirms you’re timing markets, not chasing them |
| Quality rejection rate | Below 0.5% of batches | Silane rejects can halt a coating or compounding line for hours |
| On-time-in-full delivery | Above 95% | Lead times of 7–21 days leave little buffer if OTIF slips |
| CoA compliance rate | 100% digitized, in-spec | Regulatory traceability depends on this entirely |
| Inventory write-off from expiry | Zero tolerance on premium grades | Hydrolytically sensitive grades lose activity; write-offs are pure waste |
Change Management: The Part Teams Underestimate
Platform adoption fails most often not because of technology but because experienced procurement staff distrust scores that contradict long-held supplier preferences. The practical fix is transparency: show buyers exactly which data inputs moved a supplier’s score in which direction. When a supplier’s on-time delivery rate drops from 97% to 89% over two quarters, the score change should be self-explanatory.
Suppliers consistently penalized by opaque scoring systems disengage from the platform portal, reducing data quality over time.True
Supplier participation in digital portals is voluntary in most procurement relationships; if scoring logic appears arbitrary, well-performing suppliers reduce their data sharing, which degrades the platform's benchmark quality for all users.
Communicate to suppliers early that the system rewards data transparency. Integrated manufacturers with strong quality systems — including those operating within China’s Zhejiang and Jiangsu silicone industrial clusters — typically benefit from objective scoring because their documentation quality is higher than smaller traders. That is the message worth delivering before Day 31.
Frequently Asked Questions About Data-Driven Silane Coupling Agent Procurement
Which grades benefit most — commodity silanes like A-151 or specialty grades like Si-69?
Both benefit, but the value drivers are fundamentally different. For commodity grades like vinyltrimethoxysilane (A-151) or APTES, the primary gains come from price cycle timing and inventory rightsizing. These products trade in reasonably competitive markets where a 4–8% price improvement is achievable simply by correlating silicon metal spot prices with purchase timing — the feedstock forecasting logic described earlier in this article does the heavy lifting.
Specialty grades like bis-silane sulfide (Si-69) or aminopropyltriethoxysilane variants used in high-performance rubber compounding are a different problem entirely. Synthesis complexity is higher, qualified sources are fewer — often two or three globally — and lead times for custom purity specifications can run 30–60 days even from established Chinese manufacturers. Here, the platform’s value lies in supply risk monitoring, CoA traceability chain, and lead time forecasting. A single batch rejection on Si-69 in a tire compound line can cost far more in downtime and reformulation than the entire annual platform license. Track both grade categories, but configure your alert thresholds and safety stock logic separately for each.
How do platforms handle pricing that is negotiated bilaterally, not exchange-listed?
This is a real structural challenge. Silane coupling agents are not traded on any commodity exchange. Published indices, where they exist at all, lag reality by weeks and cover only broad chemical families. Sophisticated procurement platforms solve this by building proprietary synthetic price indices — aggregating anonymized transaction data across their user base and layering in feedstock cost models that track silicon metal, methanol, and chlorosilane intermediate pricing. The resulting benchmark is imperfect but far more actionable than any public source. A buyer spending USD 800,000 annually on silanes who discovers their negotiated price sits 12% above the platform’s synthetic benchmark has a concrete starting point for renegotiation.
Silane coupling agent spot prices can swing ±15–30% annually, driven primarily by silicon metal and methanol feedstock cost movements.True
Silicon metal is the primary upstream input for chlorosilane intermediates, and methanol is a key reagent in methoxysilane synthesis. Both commodities experience significant price volatility, which propagates directly into silane monomer costs. This range reflects observed market behavior across multiple price cycles and is consistent with published feedstock price histories.
What level of ERP integration is actually required to get started?
Less than most IT departments will tell you. A CSV export of 12–24 months of purchase history — grade, quantity, price, supplier, delivery date — is enough to seed a platform’s demand forecasting and price benchmarking modules. Full API integration with SAP, Oracle, or Microsoft Dynamics unlocks automated PO triggering and real-time inventory synchronization, which is the target state, but it is not a prerequisite for month one. The 90-day implementation roadmap covered previously in this article explicitly stages ERP integration into phase two for exactly this reason.
How should a buyer evaluate a Chinese manufacturer’s readiness for a data-driven procurement relationship?
Four indicators matter in practice. First, willingness to share batch-level production records and raw material traceability — a supplier who cannot produce silicon metal lot provenance is a transparency risk regardless of their price. Second, availability of a supplier portal or EDI connection for structured data exchange rather than ad hoc email attachments. Third, internationally recognized quality certifications: ISO 9001 is the floor; IATF 16949 is relevant for automotive supply chains. Fourth, demonstrated export compliance capability — full SDS in your required language, proper REACH registration status for EU-bound material, and TSCA compliance documentation for US imports. A supplier like SiliconChemicals operating across 30-plus export markets will have built these systems out of operational necessity. A smaller domestic-focused manufacturer may not have them at all.
Can platforms manage the hazardous goods documentation specific to silanes?
Yes — and this is one of the more underappreciated operational benefits. Leading platforms include a document management module that stores and versions IMDG declarations, safety data sheets, TREM cards, and dangerous goods declarations by shipment and batch. Automated expiry alerts prevent the scenario where a shipment is held at port because an SDS version is outdated. Mandatory document attachment to logistics bookings before confirmation adds a hard process gate that email-based workflows simply cannot enforce consistently.
What is a realistic ROI timeline?
For a mid-size buyer with USD 500,000–2,000,000 in annual silane spend, platform implementation — software license plus integration services — typically runs USD 30,000–80,000, depending on ERP complexity and the number of supplier connections required. Price savings alone, in the 4–10% range depending on baseline procurement discipline and market conditions, typically return the investment within 6–12 months. That calculation excludes quality failure reduction and the compliance labor savings from automated document management, both of which are real but harder to forecast precisely before deployment. The honest answer is that buyers with fragmented, reactive purchasing habits see faster payback; buyers who already run disciplined procurement will see more modest but still positive returns.
Partnering With SiliconChemicals: How an Integrated Manufacturer Amplifies Platform Value
Every capability described in this article — feedstock signal tracking, automated CoA verification, TCO modeling, compliance document management — depends on one thing the platform itself cannot generate: clean, complete, upstream-linked data from the supplier. This is where the structural difference between an integrated manufacturer and a trading intermediary becomes a procurement liability or an advantage, depending on which you’ve chosen.
Data Depth That Only Vertical Integration Provides
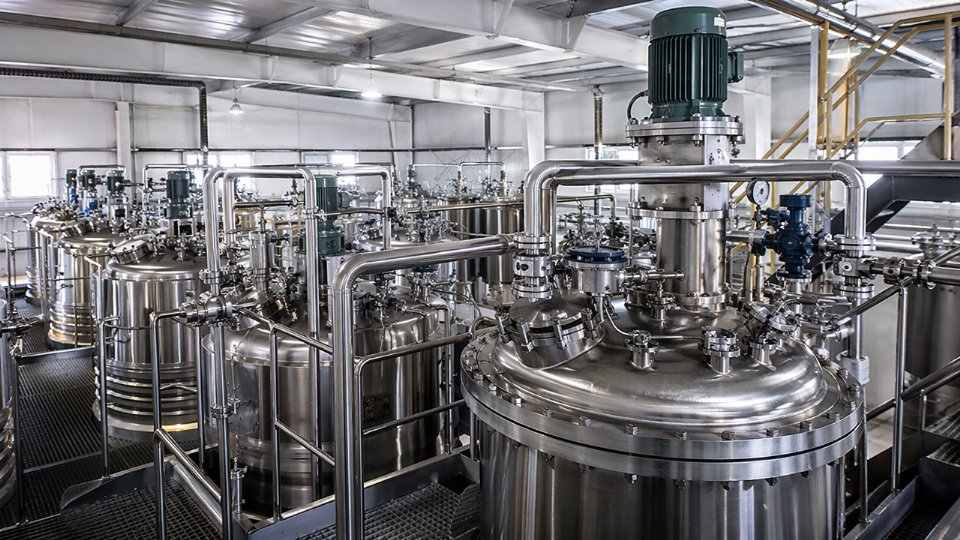
When SiliconChemicals ships a batch of KH-550 (3-aminopropyltriethoxysilane), the data trail behind that shipment runs from the silicon metal input lot and methanol feedstock specification through the chlorosilane intermediate synthesis records, the aminofunctionalization reaction batch log, inline GC purity readings during distillation, moisture content at fill, final CoA with chromatographic trace, packaging inspection record, and the freight booking with IMDG-compliant hazmat documentation. A trading company forwarding the same product can share only the documents it received — a CoA and an SDS, with no upstream visibility into batch conditions or input quality.
For a procurement platform doing automated CoA verification and supplier performance scoring, this difference is not cosmetic. Batch traceability linked to input lot quality lets the platform correlate specification drift with specific feedstock windows — exactly the kind of pattern recognition that reduces qualification failures and incoming inspection costs. Without it, QC deviations arrive as surprises.
Portfolio Consolidation: One Qualified Source, Multiple Product Families
Supplier qualification is expensive. A realistic digital onboarding process for a specialty chemical supplier — document collection, technical review, sample evaluation, audit scheduling — consumes 40–120 hours of procurement and QC staff time per supplier, depending on internal standards and product complexity. Every additional supplier relationship the platform must manage multiplies that overhead.
SiliconChemicals supplies amino silanes (KH-550, KH-602), epoxy silanes (KH-560), methacryloxy silanes (KH-570), vinyl silanes (A-151, A-172), mercapto silanes (KH-590), and bis-silane sulfide compounds from a single production and quality system. Buyers running composite manufacturing, adhesive formulation, rubber compounding, and surface treatment lines — often requiring three to six distinct coupling agents across product families — can consolidate those needs under one qualified supplier record in the platform. Logistics consolidation follows: combined shipments reduce per-kg freight cost and simplify hazmat documentation handling, which matters when IMDG-classified products are moving under tight scheduling windows.
Reducing active silane supplier relationships from four to two can cut annual supplier management overhead by 30–50% for mid-sized procurement teams.True
This range reflects documented time savings from supplier consolidation programs in specialty chemical procurement, driven primarily by reduced audit cycles, fewer incoming inspection protocols, and simplified accounts payable workflows — actual savings depend on internal QC rigor and shipment frequency.
Custom Grade Development With Full Documentation Transfer
Non-standard requirements — co-hydrolyzed silane blends, customer-specific purity floors above standard commercial grade, application-targeted diluted formulations — are common in technically demanding manufacturing. The problem is not always formulation feasibility. It’s documentation. A procurement platform ingesting a custom grade into its approved materials database needs development batch records, scale-up data, and stability testing results, not just a CoA for the final product.
SiliconChemicals provides full development documentation for custom grades as structured deliverables, formatted to be ingested directly into supplier qualification modules rather than filed as PDF attachments that no one retrieves during an audit.
Logistics and Compliance Data in Structured Form
Direct export to more than 30 countries, established freight forwarder relationships, and multi-language SDS availability in English, German, Korean, and Japanese means that the document streams feeding a platform’s compliance module — REACH registration references, TSCA inventory status, export classification records — arrive in consistent, structured formats rather than ad hoc responses to individual document requests.
Strategic Alignment With the Data-Driven Procurement Model
Trading intermediaries are optimized for transaction volume; the business model rewards finding the lowest spot price on each cycle. SiliconChemicals is built around repeat industrial customers who measure value through specification consistency, on-time delivery, and supply continuity over years. That is exactly the supplier profile that continuous performance scoring rewards — and the one a data-driven procurement platform is designed to identify and retain. The digital transition, far from being a threat to that relationship, makes the performance record visible and defensible to every stakeholder inside the buyer’s organization.