
China’s exports of polysiloxanes in primary forms fell sharply in April 2026, declining 61.57% month-on-month and 20.79% year-on-year, following the removal of export tax rebates effective April 1. Despite the substantial monthly contraction, cumulative exports during the first four months of 2026 remained 33.71% higher than a year earlier.
China’s Polysiloxane Exports Drop 61.57% in April 2026
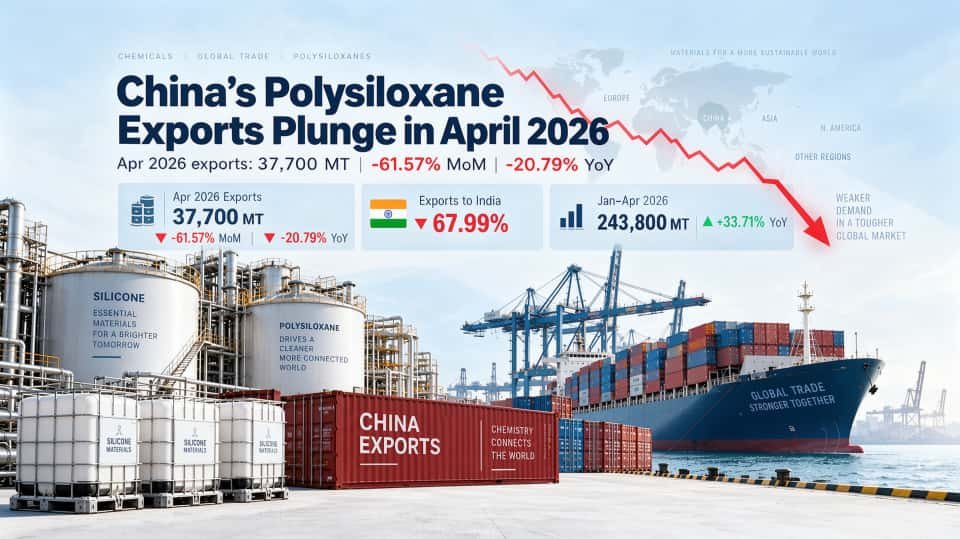
According to customs data reported on May 24, China’s exports of polysiloxanes in primary forms reached just 37,700 metric tons in April 2026, representing a significant decline from the previous month.
Export volumes dropped 61.57% month-on-month and 20.79% year-on-year, reflecting a sharp adjustment in China’s silicone export market following changes to the export tax rebate policy.
The reported figures highlight the scale of the monthly contraction.
| Export Indicator | April 2026 |
|---|---|
| Export Product | Polysiloxanes in Primary Forms |
| Export Volume | 37,700 Metric Tons |
| Month-on-Month Change | -61.57% |
| Year-on-Year Change | -20.79% |
| Export Tax Rebate Removal | Effective April 1, 2026 |
The decline was closely associated with the removal of export tax rebates for polysiloxanes in primary forms, which took effect on April 1, 2026.
The policy adjustment created a significant shift in shipment timing, contributing to a temporary imbalance between March and April export volumes.
 china polysiloxane exports april 2026
Export Tax Rebate Removal Triggers Sharp Market Adjustment
The removal of export tax rebates was identified as a major factor behind the sharp decline in April’s polysiloxane export volume.
Before the policy took effect, March 2026 became an important transition period for Chinese silicone exporters and international buyers.
Many downstream customers accelerated purchasing and inventory replenishment, while exporters brought forward shipments to complete transactions before the new policy came into force.
This concentrated export activity in March effectively brought forward part of the demand that would otherwise have been fulfilled in subsequent months.
Consequently, export volumes declined significantly in April as the market adjusted to the new policy environment.
The sharp month-on-month contraction therefore reflects not only changes in export activity but also the influence of shipment scheduling and advance purchasing during the policy transition.
New export orders and follow-up shipments were relatively subdued in April compared with the unusually high activity recorded in March.
South Korea Becomes China’s Largest Polysiloxane Export Destination
Changes in export volumes were also evident across China’s major overseas markets.
In April 2026, South Korea ranked first among China’s export destinations for polysiloxanes in primary forms, receiving approximately 7,200 metric tons.
India, Vietnam, the United States, and the Netherlands followed as the other leading export destinations.
Together, these five markets accounted for 49.74% of China’s total polysiloxane exports during the month.
| Ranking | Export Destination | April 2026 Performance |
|---|---|---|
| 1 | South Korea | 7,200 Metric Tons |
| 2 | India | Month-on-Month Decline of 67.99% |
| 3 | Vietnam | Significant Month-on-Month Decline |
| 4 | United States | Significant Month-on-Month Decline |
| 5 | Netherlands | Significant Month-on-Month Decline |
| — | Top Five Combined | 49.74% of Total Exports |
The concentration of nearly half of China’s polysiloxane exports in these five markets demonstrates their importance to the country’s international silicone trade.
However, the substantial month-on-month declines across major destinations also indicate that the impact of the policy transition was widespread rather than limited to a single market.
India’s Polysiloxane Imports from China Fall 67.99%
Among China’s major export destinations, India recorded the most pronounced monthly decline.
China’s exports of polysiloxanes in primary forms to India fell 67.99% month-on-month in April 2026, making it the sharpest contraction among the leading markets highlighted in the report.
The decline occurred alongside significant reductions in shipments to South Korea, Vietnam, the United States, and the Netherlands.
India remains an important market for Chinese silicone products, with demand linked to downstream industries such as construction, automotive manufacturing, electrical equipment, coatings, and industrial materials.
Nevertheless, the April figures illustrate how changes in export policies and shipment schedules can produce considerable short-term fluctuations in bilateral chemical trade.
The reported decline does not necessarily indicate an equivalent reduction in underlying consumption, particularly given the advance purchasing activity that occurred in March.
January–April 2026 Polysiloxane Exports Rise 33.71%
Despite the sharp contraction in April, China’s cumulative polysiloxane export figures remained positive.
From January through April 2026, China exported approximately 243,800 metric tons of polysiloxanes in primary forms, representing a 33.71% year-on-year increase.
This growth rate was considerably higher than the 8.71% year-on-year increase recorded during the corresponding period in 2025.
| Export Indicator | Reported Figure |
|---|---|
| January–April 2026 Export Volume | 243,800 Metric Tons |
| January–April 2026 YoY Growth | +33.71% |
| January–April 2025 YoY Growth | +8.71% |
| April 2026 Export Volume | 37,700 Metric Tons |
| April 2026 MoM Change | -61.57% |
The cumulative figures present a different picture from the April monthly results.
While exports contracted sharply following the policy adjustment, total shipments during the first four months of 2026 remained substantially higher than in the same period of the previous year.
However, the strong cumulative growth should also be interpreted in the context of the accelerated shipments recorded before the April policy change.
Part of the increase may reflect changes in shipment timing rather than an equivalent expansion in underlying market consumption.
The coming months will therefore be important for evaluating whether overseas purchasing activity returns to a more stable pattern.
Outlook for China’s Silicone Export Market
The April 2026 export figures illustrate the short-term disruption associated with the removal of export tax rebates on polysiloxanes in primary forms.
The 61.57% month-on-month decline was particularly pronounced because March shipments had been accelerated ahead of the policy transition.
Nevertheless, the 33.71% year-on-year growth recorded during January–April indicates that overall export activity remained strong across the four-month period.
For Chinese silicone manufacturers and international buyers, several factors will be important in assessing the market’s subsequent development.
These include the normalization of export orders following the policy adjustment, overseas inventory levels, purchasing activity in major destination markets, and the ability of exporters and importers to adapt to the revised tax environment.
The export performance of major markets, particularly South Korea, India, Vietnam, the United States, and the Netherlands, will also provide useful indicators of future trade developments.
Although April’s decline was substantial, a single month’s figures are insufficient to establish a sustained downturn in international demand.
Further monthly customs data will be needed to determine whether the export market stabilizes after the temporary effects of advance shipments and policy-related adjustments diminish.
Conclusion
China’s polysiloxane export market experienced a significant adjustment in April 2026, with exports falling to 37,700 metric tons, down 61.57% from March and 20.79% from April 2025.
South Korea remained the leading export destination, while India recorded a particularly sharp month-on-month decline of 67.99%.
Despite these decreases, cumulative exports from January to April reached 243,800 metric tons, maintaining year-on-year growth of 33.71%.
These figures highlight the importance of distinguishing short-term policy-driven export fluctuations from broader trends in international silicone trade.
For participants in the global silicone chemicals industry, monitoring changes in export volumes, trade policies, and purchasing patterns will remain essential for informed sourcing and supply chain planning.
Source: China customs export data as reported on May 24, 2026.
Product Scope: Polysiloxanes in Primary Forms.
Note: The figures and policy information in this article are based on the supplied industry report. They have not been independently verified against the original customs release or relevant tax policy documents.