English compilation and chart reconstruction by SiliconChemicals. Reporting period: August 2026. Based on an industry report published on September 24, 2026.
China’s silicon metal exports rebounded in August 2026, reaching 73.1 thousand tonnes, up 29% from July. Shipments nevertheless remained 5% below August 2025, showing that the monthly recovery did not translate into year-on-year growth. For January–August, reported exports totaled 509.0 thousand tonnes, an increase of 4% year on year. [1]
The increase in volume coincided with a lower average export unit value. August’s reported average was USD 1,339 per tonne, down USD 17.6 per tonne from July. Japan, India and South Korea were the largest destinations by volume. Together, they accounted for approximately 42.17% of the exports recorded in the detailed destination table.
Download the full report (PDF)
| Indicator | Reported figure | Comparison |
|---|---|---|
| August 2026 export volume | 73.1 thousand tonnes | Up 29% month on month; down 5% year on year |
| January–August 2026 export volume | 509.0 thousand tonnes | Up 4% year on year |
| August 2026 average export unit value | USD 1,339/t | Down USD 17.6/t from July |
 china silicon metal exports, august 2026\
Monthly export volumes, 2024–2026
August shipments rose from 56.5 thousand tonnes in July to 73.1 thousand tonnes, making August the highest month in the reported January–August 2026 series. The result also exceeded August 2024’s 64.8 thousand tonnes, but remained below the 76.6 thousand tonnes recorded in August 2025.
The monthly comparison matters when interpreting the rebound. A strong increase from July describes a recovery from the preceding month, while the year-on-year comparison shows that shipments had not returned to the previous August’s level. The figures alone do not identify whether the change came from demand, shipment timing or inventory decisions.
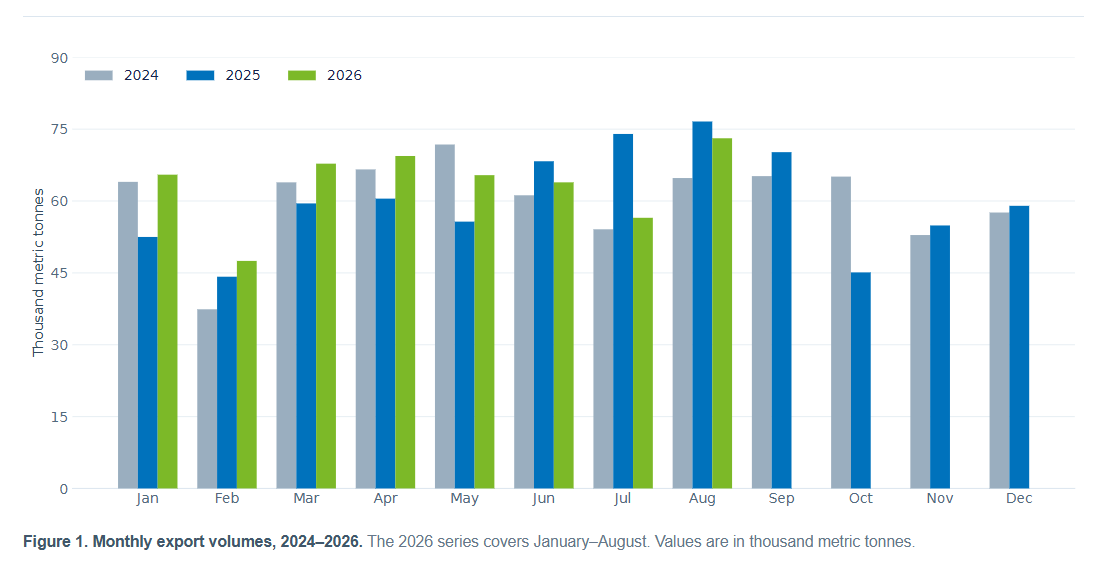 monthly export volumes, 2024–2026.\
The following table retains all reported monthly values. Volumes are expressed in thousand metric tonnes. The 2026 series ends in August; the remaining entries are unavailable, rather than zero.
| Month | 2024 | 2025 | 2026 |
|---|---|---|---|
| Jan | 64.0 | 52.5 | 65.5 |
| Feb | 37.4 | 44.2 | 47.5 |
| Mar | 63.9 | 59.5 | 67.8 |
| Apr | 66.6 | 60.5 | 69.4 |
| May | 71.8 | 55.7 | 65.4 |
| Jun | 61.2 | 68.3 | 63.9 |
| Jul | 54.1 | 74.0 | 56.5 |
| Aug | 64.8 | 76.6 | 73.1 |
| Sep | 65.2 | 70.2 | — |
| Oct | 65.1 | 45.1 | — |
| Nov | 52.9 | 54.9 | — |
| Dec | 57.6 | 59.0 | — |
Rounding note: The individually rounded January–August 2026 figures sum to 509.1 thousand tonnes, while the source reports a cumulative total of 509.0 thousand tonnes. Both are retained at their published precision. The difference is consistent with rounding of the monthly disclosures.
Average export unit value declined as shipments increased
The reported August average export unit value of USD 1,339 per tonne fell even as export tonnage increased. This separates the month’s volume recovery from its pricing performance: higher shipments did not coincide with a higher overall unit value.
An export unit value represents the value of recorded trade relative to its weight. It should not be treated as a supplier quotation for a particular silicon metal grade, specification or shipment. The destination table also shows substantial variation, so the overall average needs to be read alongside the market-level figures.
Japan, India and South Korea led export destinations
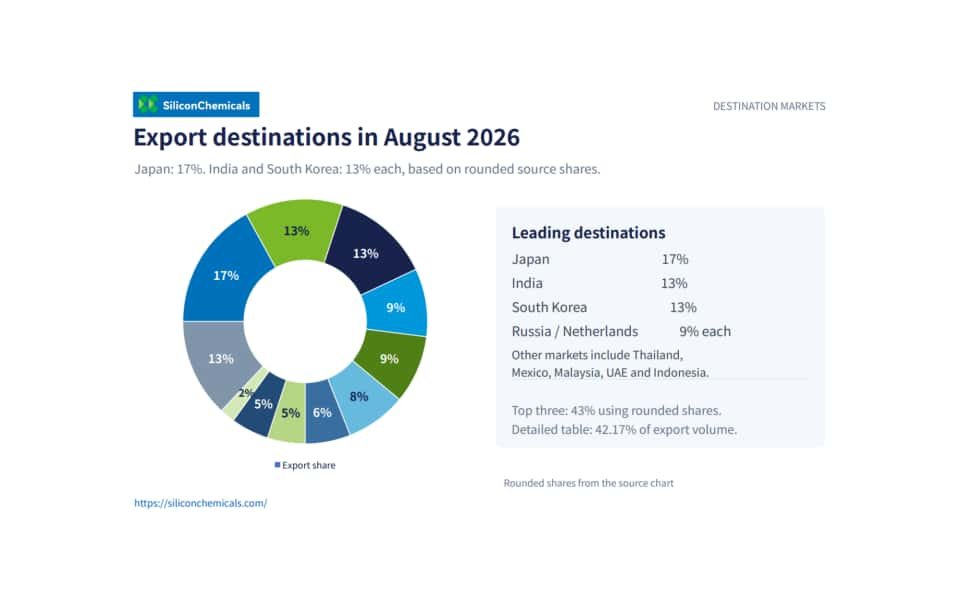
Japan was the largest destination, receiving 12,181,521 kg, followed by India with 9,388,000 kg and South Korea with 9,241,007 kg. Russia and the Netherlands were close behind one another at 6,909,000 kg and 6,904,000 kg, respectively.
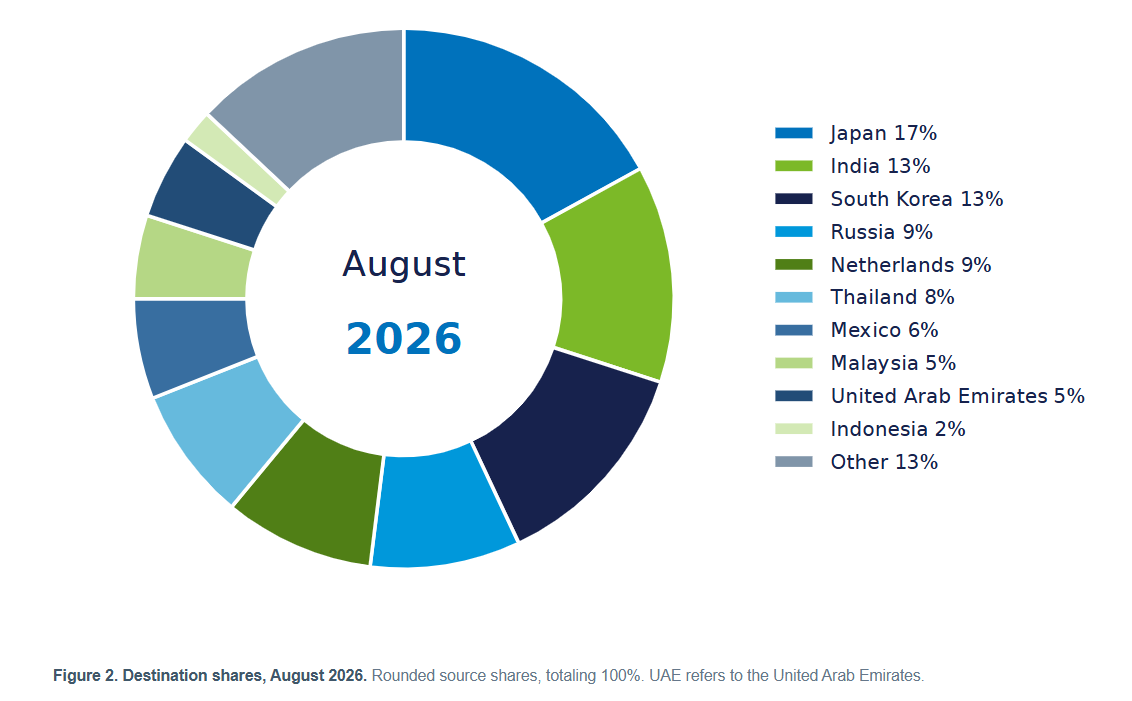 destination shares, august 2026\
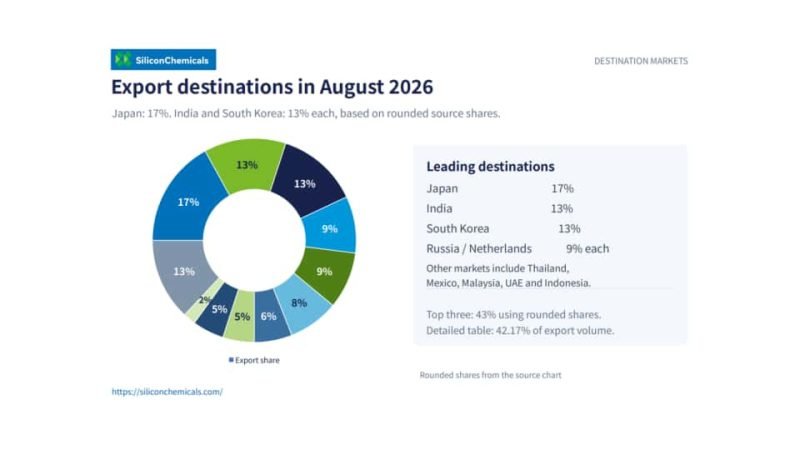
The source’s rounded destination chart assigns 17% to Japan and 13% each to India and South Korea. Russia and the Netherlands each account for 9%. Thailand, Mexico, Malaysia, the United Arab Emirates and Indonesia make up the other individually identified markets.
| Destination | Rounded share |
|---|---|
| Japan | 17% |
| India | 13% |
| South Korea | 13% |
| Russia | 9% |
| Netherlands | 9% |
| Thailand | 8% |
| Mexico | 6% |
| Malaysia | 5% |
| United Arab Emirates | 5% |
| Indonesia | 2% |
| Other | 13% |
Adding the three leading destinations’ displayed chart shares gives 43%. Calculating their share from the detailed quantities gives 30,810,528 kg out of 73,061,062 kg, or approximately 42.17%. These figures use different levels of precision and should not be presented as interchangeable exact shares.
Japan: the largest destination, with a year-on-year comparison
China shipped approximately 12,182 tonnes to Japan in August 2026. The source compares this with approximately 12,624 tonnes in August 2025 and describes Japanese demand as stable. The comparison therefore concerns the same month of the previous year. It does not establish a month-on-month increase for Japan.
The source narrative cites Japanese export prices of approximately USD 1,490–1,520 per tonne, while its destination table gives an average unit value of USD 1,468 per tonne. Both are above the reported overall August average, but the source does not explain the difference between the narrative range and the tabulated figure.
India: shipments increased from July
Exports to India reached 9,388 tonnes, compared with 8,540 tonnes in July 2026. Unlike the Japanese comparison, these figures support a month-on-month increase.
The source describes India’s imports as including a higher proportion of lower-grade silicon. Its narrative cites a price of approximately USD 1,300 per tonne, whereas the destination table reports USD 1,262 per tonne. The differing figures are retained below without assuming that they share the same reporting basis.
| Metric | Japan | India |
|---|---|---|
| August 2026 volume (tonnes) | 12,182 | 9,388 |
| Comparison volume (tonnes) | Aug 2025: approx. 12,624 | Jul 2026: 8,540 |
| Price cited in article (USD/t) | Approx. 1,490–1,520 | Approx. 1,300 |
| Country-table unit value (USD/t) | 1,468 | 1,262 |
EU anti-dumping review and changes in supply
The European Commission initiated an interim review of anti-dumping measures on silicon originating in China on September 1, 2026. The review covers both dumping and injury. Its initiation opens an investigation; it does not itself establish a new duty rate. [2]
Article 1 of Commission Implementing Regulation (EU) 2022/1394 lists an anti-dumping duty of 16.8% for all other companies and 16.3% for Datong Jinneng Industrial Silicon Co., Ltd., subject to the regulation’s conditions. [3]
The source industry article expects limited immediate effects on China’s export volumes while the review proceeds. It also identifies tighter EU and U.S. trade barriers as a longer-term risk. These are the article’s market assessments, rather than findings or outcomes of the EU review.
Angola’s reported role in European supply
The source article also reports a shift of Chinese silicon production to locations including Angola. It puts Angola’s average monthly silicon metal exports in 2026 at approximately 4,000 tonnes, with more than 90% destined for the EU. [1]
Those figures have not been independently corroborated, and the source does not identify the months included in its 2026 average. They provide context for the article’s discussion of alternative supply, but do not establish how European trade flows will change during or after the review.
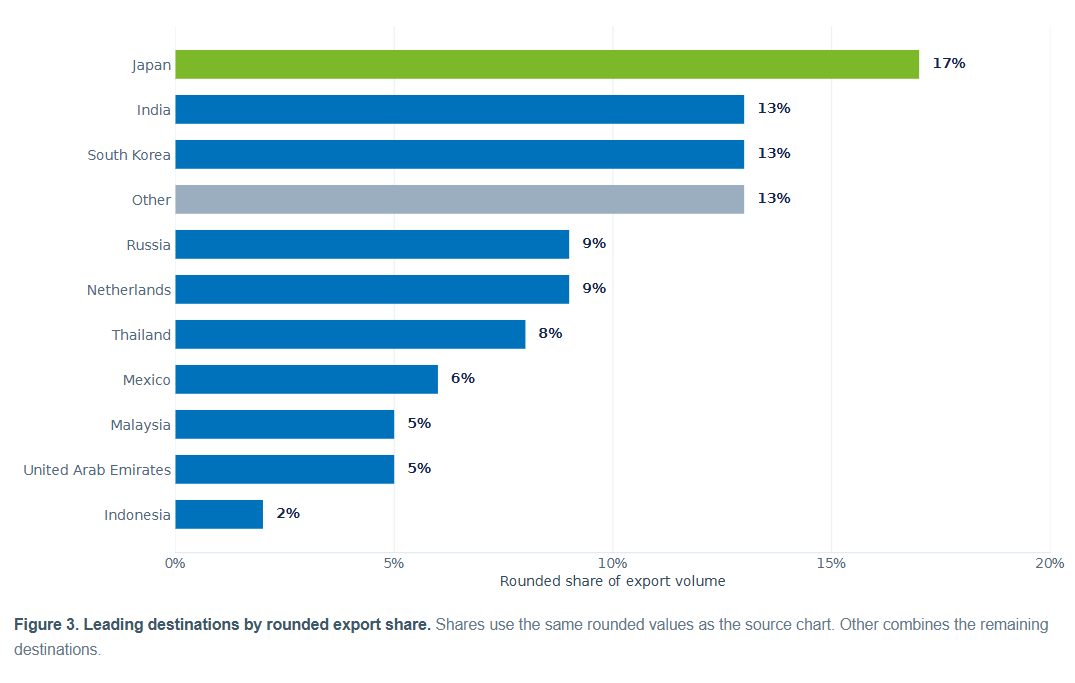 leading destinations by rounded export share\
Complete export data by destination
The table below reproduces all 48 destinations in the report, in their original order. Volumes are in kilograms, export values are in U.S. dollars, and reported unit values are in U.S. dollars per metric tonne.
| Rank | Destination | Volume (kg) | Export value (USD) | Unit value (USD/t) |
|---|---|---|---|---|
| 1 | Japan | 12,181,521 | 17,887,538 | 1,468 |
| 2 | India | 9,388,000 | 11,850,244 | 1,262 |
| 3 | South Korea | 9,241,007 | 12,435,104 | 1,346 |
| 4 | Russia | 6,909,000 | 9,506,441 | 1,376 |
| 5 | Netherlands | 6,904,000 | 8,586,997 | 1,244 |
| 6 | Thailand | 5,598,000 | 8,223,746 | 1,469 |
| 7 | Mexico | 4,733,000 | 6,003,494 | 1,268 |
| 8 | Malaysia | 3,725,000 | 4,807,038 | 1,290 |
| 9 | United Arab Emirates | 3,341,000 | 4,452,250 | 1,333 |
| 10 | Indonesia | 1,321,028 | 1,613,574 | 1,221 |
| 11 | Brazil | 1,310,000 | 1,787,520 | 1,365 |
| 12 | United Kingdom | 1,211,000 | 1,460,300 | 1,206 |
| 13 | Italy | 1,196,000 | 1,526,100 | 1,276 |
| 14 | Türkiye | 1,177,000 | 1,727,620 | 1,468 |
| 15 | Vietnam | 1,109,000 | 1,266,923 | 1,142 |
| 16 | Taiwan, China | 752,988 | 1,030,042 | 1,368 |
| 17 | Belgium | 698,000 | 1,090,927 | 1,563 |
| 18 | Poland | 648,000 | 579,365 | 894 |
| 19 | Bahrain | 296,000 | 351,860 | 1,189 |
| 20 | Philippines | 230,000 | 284,363 | 1,236 |
| 21 | Argentina | 150,000 | 191,125 | 1,274 |
| 22 | Australia | 140,000 | 232,400 | 1,660 |
| 23 | South Africa | 100,000 | 123,325 | 1,233 |
| 24 | Slovenia | 100,000 | 130,750 | 1,308 |
| 25 | Mongolia | 79,400 | 23,390 | 295 |
| 26 | Uzbekistan | 63,000 | 82,714 | 1,313 |
| 27 | Pakistan | 62,000 | 76,634 | 1,236 |
| 28 | Nigeria | 50,000 | 62,500 | 1,250 |
| 29 | Sweden | 50,000 | 69,000 | 1,380 |
| 30 | Cambodia | 37,000 | 55,986 | 1,513 |
| 31 | Tanzania | 28,000 | 35,044 | 1,252 |
| 32 | Qatar | 25,000 | 32,000 | 1,280 |
| 33 | Serbia | 25,000 | 29,000 | 1,160 |
| 34 | Chile | 25,000 | 32,250 | 1,290 |
| 35 | Colombia | 25,000 | 34,750 | 1,390 |
| 36 | Albania | 25,000 | 32,450 | 1,298 |
| 37 | Montenegro | 25,000 | 29,000 | 1,160 |
| 38 | Canada | 20,000 | 11,000 | 550 |
| 39 | Algeria | 20,000 | 10,800 | 540 |
| 40 | Dominican Republic | 10,000 | 12,000 | 1,200 |
| 41 | Turkmenistan | 8,160 | 10,445 | 1,280 |
| 42 | Bangladesh | 6,000 | 7,020 | 1,170 |
| 43 | Kyrgyzstan | 6,000 | 7,826 | 1,304 |
| 44 | Ecuador | 5,000 | 10,500 | 2,100 |
| 45 | Saudi Arabia | 3,000 | 4,830 | 1,610 |
| 46 | Peru | 2,000 | 7,185 | 3,593 |
| 47 | Sri Lanka | 1,900 | 2,910 | 1,532 |
| 48 | United States | 58 | 3,425 | — |
The source leaves the U.S. unit value blank. It is shown as “—” here, with no calculated replacement. Reported figures, including unusually low or high unit values, are retained without adjustment.
Reading the August results
August’s clearest development was the recovery in shipment volume from July, alongside a decline in the reported average export unit value. Japan, India and South Korea remained central to the destination mix, but the underlying comparisons differed by market.
For readers tracking subsequent months, the relevant questions are whether export volumes remain above the July level, whether average unit values stabilize, and whether the EU review produces changes to the applicable measures. The August figures provide a reference point for those comparisons, without establishing a forecast for the remainder of the year.
Data notes and sources
This article presents an English compilation of the supplied industry report. SiliconChemicals is responsible for the English presentation and chart reconstruction, rather than the original collection of the trade statistics.
All tonnes are metric tonnes. Monthly volumes retain one decimal place in thousand tonnes. Headline percentage changes and the rounded destination shares retain the source’s precision. The monthly total, destination-share calculation and Japan–India price differences are explained where they appear. Export unit values are aggregate trade measures, not quotations for specific grades.
- SiliconChemicals: China’s Silicon Metal Exports, August 2026 (PDF). English compilation of industry information published on September 24, 2026, including trade volumes, destination data and attributed market commentary.
- European Commission, Notice C/2026/4547: initiation of an interim review of anti-dumping measures on silicon originating in China, September 1, 2026.
- Commission Implementing Regulation (EU) 2022/1394, Article 1, August 11, 2022.