Procurement teams and plant engineers who buy silicone oil regularly know the frustration: you budget based on last quarter’s price, the purchase order comes back 20–30% higher, and suddenly your lubrication or release-agent line item blows the maintenance budget for the month. That delta isn’t random. It traces back to a chain of upstream variables — silicon metal spot rates, polymerization complexity, viscosity grade, and the regulatory burden baked into pharmaceutical or cosmetic specifications — and if you can’t read that chain, you’re always reacting instead of anticipating.
Silicone oil price is driven primarily by silicon metal feedstock costs (USD 1,800–3,500/metric ton depending on energy prices and regional supply), viscosity and purity grade, and order volume. Industrial-grade PDMS at 350 cSt typically runs USD 2.50–6.80/kg; cosmetic or pharma-grade climbs to USD 8–18/kg; specialty functional grades can reach USD 15–40/kg or beyond.
What makes this genuinely tricky is that several of those drivers move independently and don’t always move together. Silicon metal can spike because of hydropower curtailments in Yunnan or Sichuan, while demand for high-purity grades softens because a medical device OEM shifted formulations. Understanding which lever is actually moving the price you’re seeing — and whether it’s temporary or structural — is what separates a procurement manager who negotiates well from one who just accepts the invoice.
How Silicon Metal and Chlorosilane Feedstock Costs Set the Price Floor
Silicone oil doesn’t start its life in a reactor full of polymers. It starts in a quarry. Understanding that chain — quartz to silicon metal to chlorosilane monomer to finished PDMS — is the only way to reason intelligently about where prices can and cannot go.
Silicon Metal: Energy-Intensive and Geographically Concentrated
Producing silicon metal means reducing high-purity quartz (SiO₂) with carbon in submerged electric arc furnaces running above 1,500 °C, typically closer to 1,800 °C in practice. The process is brutally energy-intensive — around 11–13 MWh of electricity per metric ton of silicon metal, depending on furnace design, electrode condition, and raw material moisture content. That energy cost doesn’t compress easily. You can optimize logistics and labor, but you cannot negotiate with thermodynamics.
Silicon metal currently trades in the range of USD 1,800–3,500 per metric ton on global markets, and that spread is almost entirely explained by energy prices and where the metal was smelted. From a finished-product standpoint, silicon metal feedstock accounts for roughly 30–45% of the fully-loaded cost of industrial-grade silicone oil — the exact share shifts depending on polymerization yields, plant scale, and whether the producer is integrated back to monomer synthesis or buying chlorosilanes on the open market.
The Müller-Rochow Reaction: Where Yield Efficiency Becomes a Cost Multiplier
Converting silicon metal into usable silicone precursor isn’t a clean, single-product reaction. The Müller-Rochow (Direct Process) passes methyl chloride vapor over a fluidized bed of silicon metal powder in the presence of a copper catalyst, producing a mixture of methylchlorosilanes. The target product is dimethyldichlorosilane (Me₂SiCl₂), which becomes the backbone of PDMS after hydrolysis and condensation. In a well-run plant with optimized catalyst and tight temperature control, selectivity toward Me₂SiCl₂ runs somewhere between 75–85% of total chlorosilane output. The rest — trimethylchlorosilane, methyltrichlorosilane, and various higher-order silanes — has value, but not always the same value, and disposing of or reprocessing the byproduct stream costs money.
This matters for pricing because a plant running at 78% selectivity versus one running at 84% is producing meaningfully different amounts of usable PDMS precursor per kilogram of silicon metal consumed. That delta flows straight into the monomer cost basis. Buyers negotiating long-term supply contracts who ignore this rarely understand why their supplier’s price floor seems higher than spot-market math suggests it should be.
Geographic Concentration: China’s Grip on the Supply Curve
China produces roughly 70–75% of global silicon metal output, concentrated heavily in Yunnan, Sichuan, and Xinjiang provinces where hydroelectric or coal power has historically been cheap. That concentration means Chinese domestic policy — electricity tariffs, environmental enforcement cycles, export regulations — doesn’t just affect Chinese buyers. It moves the global price.
The clearest recent benchmark: in the second half of 2021, China’s power rationing policy forced curtailments at energy-intensive smelters across multiple provinces. Silicon metal output dropped sharply, and global silicone prices rose roughly 40–80% within two quarters, depending on viscosity grade and contract structure.
China's 2021 power rationing caused global silicone oil prices to rise 40–80% within two quartersTrue
Multiple industry reports and procurement records from 2021–2022 document silicon metal supply disruption in China following provincial power curtailment policies, with downstream silicone polymer prices rising sharply across global markets in that period.
Procurement managers who weren’t modeling this as a supply risk before 2021 certainly were afterward. The lesson isn’t that China is uniquely unreliable — it’s that when 70%+ of any feedstock comes from one geography, that geography’s grid stability is your problem too.
Methyl Chloride: The Natural Gas Wildcard
There’s a second fossil-fuel input that doesn’t get enough attention: methyl chloride (CH₃Cl), produced from methanol and hydrogen chloride, is the carbon-donating co-reagent in the Müller-Rochow process. Methanol pricing traces back to natural gas. When European natural gas spiked in 2022, methyl chloride costs moved with it — adding a secondary, largely uncorrelated volatility layer on top of silicon metal price swings.
In a year where silicon metal is stable but natural gas is spiking, or vice versa, the finished silicone oil price can still move significantly. The two inputs don’t always correlate. That’s exactly what makes simple commodity-index hedging inadequate for silicone oil procurement. You’re effectively exposed to electricity markets, coal and hydro power availability, and natural gas futures simultaneously, all before the polymerization plant adds its own overhead.
Viscosity Grade and Chemical Specification as Primary Price Multipliers
If you’ve ever requested quotes for silicone oil and wondered why two drums labeled “silicone oil” can differ by a factor of eight in unit price, viscosity grade and chemical specification are usually where the answer lives. The base polymer — polydimethylsiloxane — is the same starting molecule across most of the product range, but what happens to it during processing, how tightly it’s characterized, and what functional groups get grafted onto the backbone determines the final price far more than feedstock cost alone.
How Viscosity Extremes Drive Cost Up From Both Ends
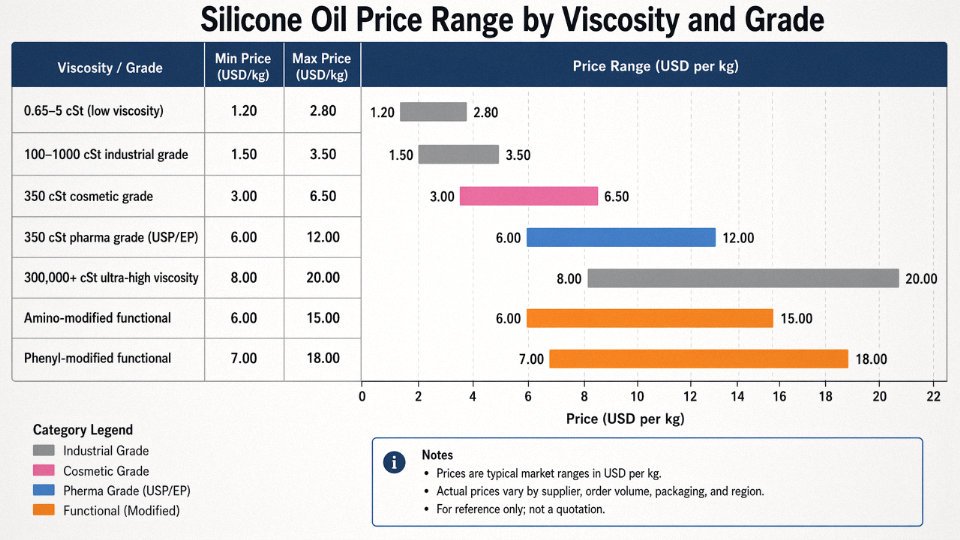
The workhorse of industrial silicone oil is the 100–1,000 cSt range, with 350 cSt being the most heavily traded grade and typically the cheapest per kilogram — roughly USD 2.50–5.00/kg for technical-grade material in bulk, depending on order size and regional supply. Everything away from that center of gravity gets more expensive, for different reasons.
At the low end, 0.65 cSt hexamethyldisiloxane (MM fluid) and 1–5 cSt grades require careful fractionation to isolate short polymer chains. The process yield for those cuts is lower, and the material is more volatile, which creates handling and regulatory complications — particularly around cyclic volatile methyl siloxane (VMS) content in markets where D4/D5/D6 restrictions apply. Expect a 20–60% price premium over 350 cSt depending on the spec.
Ultra-high-viscosity grades, say 300,000 cSt and above up to gum-phase material at 1,000,000+ cSt, require extended polymerization residence times and more controlled equilibration conditions. Batch-to-batch rheological consistency is genuinely difficult to hold at that molecular weight. Those grades typically trade at USD 6–12/kg for standard industrial quality, and higher if consistency specs are tight.
Purity Tiers: The Specification Tax
This is where buyers without a chemistry background often get surprised. The polymer chain itself may be virtually identical across grades, but the certificate of analysis and the manufacturing controls behind it are not.
Technical-grade silicone oil for mold release, transformer cooling, or industrial lubrication carries minimal documentation requirements. Cosmetic-grade material — used in personal care formulations — adds volatile siloxane limits (often D4 below 1 ppm, D5 below 10 ppm in EU-compliant product), heavy metal specifications, and traceability to cosmetic-grade raw inputs. That alone typically adds 60–150% to the base price, putting cosmetic-grade 350 cSt in the USD 8–14/kg range.
Pharmaceutical-grade material under USP or EP monograph requires full GMP manufacturing documentation, lot-specific endotoxin testing, residual solvent profiles, and a supplier Drug Master File or equivalent. The product might test identically to cosmetic-grade in a basic analytical panel. But you’re paying for the quality system, the audit trail, and the regulatory liability transfer. That pushes prices to USD 12–22/kg for standard viscosity grades, and procurement managers who try to substitute cosmetic-grade into a pharma application because “it’s the same stuff” eventually learn an expensive lesson.
Pharmaceutical-grade silicone oil is chemically identical to industrial-grade PDMS of the same viscosityFalse
While the base polymer structure may be similar, pharmaceutical-grade material must meet strict purity limits, endotoxin specifications, GMP manufacturing controls, and full regulatory documentation that are absent in industrial-grade product. The manufacturing process, testing regime, and supply chain controls differ substantially.
Functional Modification: Paying for Reaction Steps
Standard PDMS is inert by design. When an application needs something more — adhesion, reactivity, compatibility with polar substrates, or thermal stability beyond 200°C — the chemist reaches for functional silicone oils, and the price follows.
Amino-modified silicone oils (used in textile softeners and hair care) add USD 5–12/kg over base PDMS, depending on amine equivalent weight and the degree of substitution. Epoxy-functional grades for coatings and adhesion promoters run USD 8–18/kg above base. Phenyl-modified silicone oils, which extend useful temperature range and improve refractive index for optical applications, carry the steepest premium — typically USD 15–25/kg over comparable-viscosity PDMS — because phenyl content requires different monomer inputs (diphenylsilane intermediates) and tighter end-group control.
Hydrogen-terminated and vinyl-functional fluids used in addition-cure silicone systems occupy a narrower niche but command similar premiums due to the reactivity control required during synthesis. A poorly controlled hydrogen-terminated fluid can crosslink in storage. The extra process cost is real.
Consistency Requirements in Electronics and Medical
There’s a subtler cost driver that doesn’t appear on a product data sheet: batch-to-batch consistency. For an electronics application — say, thermal interface fluids in power electronics, or dielectric fluids in a sealed transformer — viscosity drift of ±15% across lots might be acceptable. For a medical device manufacturer using silicone oil as an ophthalmology tamponade agent or a semiconductor fab using it as a heat transfer medium in precision temperature control, that tolerance tightens to ±3–5%.
Holding that window requires tighter in-process controls, more frequent analytical checks, and occasional yield sacrifice when batches drift. Suppliers who can credibly demonstrate this consistency — through statistical process control data and multi-year supply history — command contract premiums of 15–30% over spot pricing, and in practice, the better buyers pay it willingly because the cost of a non-conforming batch in a medical or semiconductor context far exceeds the premium.
| Viscosity Grade | Typical 2024 Price Range (USD/kg, bulk) | Primary Application Sector |
|---|---|---|
| 0.65–5 cSt (low-MW fluids) | 4.50–9.00 | Carrier fluids, cosmetics, VMS blends |
| 10–100 cSt | 3.00–5.50 | Lubrication, mold release, textile |
| 350–1,000 cSt (workhorse) | 2.50–5.00 | Industrial, transformer, damping |
| 5,000–60,000 cSt | 4.00–7.50 | Sealants, damping fluids, personal care |
| 100,000–1,000,000 cSt (gum) | 6.00–13.00 | Rubber compounding, HCR, LSR base |
| Amino/epoxy-modified | 9.00–22.00 | Textiles, coatings, adhesion |
| Phenyl-modified | 18.00–40.00 | Optical, high-temp, aerospace |
| USP/EP pharmaceutical grade | 12.00–22.00+ | Medical devices, injectables |
Prices vary with order volume, regional origin, and specification tightness. A 1-MT order from a spot distributor will sit at the high end of these ranges; a 20-MT annual contract direct with a major producer will be at the low end or below it.
The practical takeaway for procurement: segment your silicone oil spend by specification tier before going to market. Buying pharmaceutical-grade for a general industrial application wastes money; buying technical-grade for a regulated end use creates compliance exposure. Neither mistake is rare.
Energy Intensity of Silicone Polymerization and Its Effect on Production Cost
Silicone oil doesn’t get made cheaply in terms of energy. The polymerization and distillation steps that convert chlorosilane intermediates into finished PDMS are thermally demanding in ways that buyers rarely think about until they’re trying to understand why two otherwise-identical spec sheets carry prices 30–40% apart depending on country of origin.
How Much Energy Is Actually Embedded in a Kilogram of Silicone Oil
Industry process data and published lifecycle assessments put electricity-equivalent energy consumption somewhere in the range of 8–15 MWh per metric ton of finished PDMS, though where a specific plant lands within that range depends heavily on facility age, whether distillation columns are steam- or electrically-heated, how aggressively heat integration is applied, and what viscosity grade is being produced. Higher-viscosity grades and specialty functional silicones tend to sit toward the upper end because they require tighter fractionation and longer reaction residence times.
At 10 MWh/ton as a midpoint, and using industrial electricity at USD 0.08/kWh (a reasonable approximation for a Chinese industrial tariff in a coal-heavy provincial grid), you’re looking at roughly USD 0.80/kg of energy cost embedded in the product before you’ve counted labor, depreciation, or raw materials. Run the same arithmetic with a German industrial tariff of USD 0.18–0.22/kWh and that figure jumps to USD 1.80–2.20/kg — on a product that might sell for USD 3.50–5.00/kg industrial grade. That’s not a rounding error. That’s a structural cost disadvantage.
Regional Energy Structures and Why They Produce Different Factory Gate Prices
China’s silicone production belt — concentrated in Xinjiang, Yunnan, and parts of Zhejiang — has historically operated on heavily subsidized coal-fired grid power, with industrial tariffs that remained below USD 0.07–0.09/kWh through most of the last decade. That advantage is real and measurable, not just a vague “lower labor cost” story. U.S. producers benefit from a different edge: cheap natural gas used both as process heat fuel and as feedstock for certain intermediates, which keeps combined energy costs competitive even as labor rates are higher. The U.S. Gulf Coast and Appalachian basin silicone facilities have used natural gas in the USD 3–6/MMBtu range for most of the past five years, and that matters.
Western European producers are working against both inputs. High renewable-transition surcharges and grid levies pushed effective industrial electricity costs to USD 0.15–0.25/kWh in Germany and the Netherlands well before the 2022 gas crisis hit. When Russian pipeline gas was disrupted in 2022, spot gas prices in Europe spiked to levels that made certain energy-intensive chemical operations economically irrational for months at a stretch. Credible industry estimates — and buyer feedback I’ve seen from procurement teams in that period — suggest Western silicone production costs increased 20–35% within roughly two quarters, driving a meaningful portion of European buyers to accelerate qualification of Asian and U.S. supply sources. That diversification shift didn’t fully reverse when gas prices normalized.
HCl Recovery Loops: The Operating Cost Variable Buyers Rarely Ask About
Chlorosilane synthesis produces significant quantities of hydrochloric acid as a co-product. Facilities with closed-loop HCl recovery and recycling infrastructure — where the acid is captured, purified, and fed back into the chlorination stage — carry structurally lower operating costs than those that treat HCl as a waste stream requiring neutralization or sale into a volatile byproduct market. The capital cost of building that recovery loop is substantial, typically recovered over 5–10 years depending on plant scale, but the ongoing energy and material savings are genuine. Plants without closed-loop systems also face increasing environmental compliance expenditure as regulations tighten, which adds cost asymmetrically.
Facilities with closed-loop HCl recovery in chlorosilane production have lower per-unit operating costs than those treating HCl as a waste stream.True
HCl recovery reduces raw material input requirements and avoids the energy and cost of waste treatment or byproduct logistics. This is well-documented in silicone industry process engineering literature and reflected in operating cost benchmarks for integrated vs. non-integrated producers.
Carbon Pricing as an Emerging Cost Layer
European producers already carry EU ETS exposure, and the math is becoming harder to ignore. Current estimates put carbon cost pass-through from silicone manufacturing at roughly USD 0.20–0.80/kg of finished product, depending on the plant’s emissions intensity and the prevailing carbon allowance price — which has ranged from EUR 50 to over EUR 100 per ton CO₂ equivalent in recent years. That’s not yet a dominant cost driver, but it’s no longer negligible, and the EU Carbon Border Adjustment Mechanism means it will eventually apply pressure on imported material too. Procurement managers quoting landed cost comparisons between Chinese and European origin product should start accounting for this trajectory, not just today’s spot differential.
How Production Geography, Trade Policy, and Tariffs Shift Delivered Price
Factory-gate price is only the starting point. By the time a drum of silicone oil lands in your warehouse, you’ve layered on freight, tariff, currency risk, and certification cost — and any one of those can swing the total by 20–40% relative to what the supplier quoted FOB. Procurement teams that compare suppliers on quoted price alone routinely get surprised at customs.
The Geographic Landscape of Production
China dominates global silicone oil output by volume, full stop. Producers in Zhejiang, Shandong, and Guangdong provinces run large, integrated plants that benefit from captive silicon metal supply, subsidized electricity in certain provinces, and scale that Western producers struggle to match on commodity grades. For a standard industrial 350 cSt PDMS, Chinese-origin material regularly undercuts European equivalents by 30–50% on a factory-gate basis. That cost advantage is real — but it comes packaged with regulatory uncertainty, batch consistency variability on lower-tier suppliers, and trade policy exposure that can reprice landed cost overnight.
Wacker in Germany and Dow Silicones in Belgium occupy a different position entirely. Their material is more expensive partly because of genuine quality controls and traceability, and partly because European energy costs — compounded by EU Emissions Trading System exposure — are structurally higher. Buyers who need pharmaceutical-grade or cosmetic-grade material with full ISO/GMP documentation usually end up here by necessity rather than preference. The ESG compliance paper trail is also increasingly demanded by Western consumer brands auditing their supply chains, which gives European-origin material a soft premium beyond the chemistry itself.
US-based production (Momentive, Dow’s domestic sites) offers a middle path: no trans-Pacific freight, no Section 301 tariff exposure, and reasonably competitive pricing on mid-volume orders, though rarely the cheapest option for bulk commodity grades. For manufacturers who experienced supply disruptions in 2021–2022, domestic sourcing became a genuine strategic argument rather than just a cost discussion.
Japan and South Korea are worth mentioning for specialty applications — high-purity dielectric grades, optical-quality fluids, certain reactive silicones — where price matters less than specification consistency. Don’t expect commodity pricing from this geography; it’s the wrong conversation.
Tariffs and Trade Measures That Directly Alter Landed Cost
US Section 301 tariffs on Chinese silicone products are not theoretical. Under HTS Chapter 39, various silicone classifications attract rates of 7.5–25% depending on the specific subheading and any subsequent USTR modifications. On a product priced at USD 3.50/kg, a 25% tariff adds USD 0.875/kg before you’ve touched a forklift. That’s enough to flip the cost advantage of Chinese-origin material against a European or domestic alternative for many buyers.
US Section 301 tariffs on Chinese silicone oil can add 7.5–25% to the dutiable value depending on HTS classification, directly increasing landed cost for US importers.True
Section 301 tariffs covering silicone-related HTS Chapter 39 subheadings were implemented in 2018–2019 and have remained in effect through the 2023–2024 review period, with rates varying by specific product classification under USTR schedules.
The EU picture is less settled. Anti-dumping investigations and import surveillance mechanisms for Chinese silicone intermediates have triggered rapid, sometimes weeks-long pricing uncertainty. A supplier might hold a firm price quote for 30 days, but if a preliminary anti-dumping determination lands during that window, the landed economics shift before your purchase order clears. Build contingency into your procurement timeline.
Freight: A Cost Component That Proved It Can Dominate
A 20-foot container of silicone oil from a Chinese port to the US West Coast adds roughly USD 0.08–0.25/kg depending on ocean freight market conditions — and that range is not academic. During the 2021–2023 supply chain disruptions, spot container rates hit levels that temporarily wiped out the entire factory-gate cost advantage of Chinese-origin material for some US buyers. Rates have since normalized, but anyone who wasn’t modeling freight as a variable learned an expensive lesson.
Currency Risk Is a Real Cost, Not a Finance Department Problem
Silicone oil is globally invoiced in USD. If you’re buying in EUR, GBP, or JPY, exchange rate movements become embedded in your effective price — and they can move faster than your contract cycle. A EUR/USD shift from 1.10 to 1.05 over a six-month supply agreement effectively raises your per-kg cost by roughly 4.5% with no change in the supplier’s behavior whatsoever. Hedging that exposure has a cost too, typically 0.5–2% annualized depending on tenor and volatility. Neither cost shows up in the supplier quote.
Build a Landed-Cost Model Before You Negotiate
The practical takeaway is mechanical but often skipped: build a landed-cost model that captures factory-gate price, ocean or overland freight, applicable tariff rate (check the specific HTS subheading, not just the chapter), currency hedge cost, and any inspection or third-party certification fees your quality system requires. Compare suppliers on that number, not the FOB quote. In my experience, teams that do this exercise sometimes find that a European supplier at USD 4.80/kg landed beats a Chinese supplier quoted at USD 3.20/kg FOB once tariffs, freight, and hedge cost are stacked in — and sometimes the Chinese material still wins. The point is that you don’t actually know until you run the model.
Demand-Side Cycles: Which End Markets Drive Silicone Oil Price Volatility
Silicone oil doesn’t have one demand base — it has five or six, and they cycle at different frequencies, often in opposite directions. That portfolio structure is what makes pricing behavior so hard to read from any single industry vantage point. A procurement manager watching only their own sector will consistently misread the market.
Electronics and Semiconductor Cycles
High-purity PDMS used in semiconductor encapsulants, thermal interface materials, and PCB conformal coatings is among the most specification-sensitive silicone oil in commercial production. The purity and viscosity tolerances involved mean it draws from a narrower slice of total production capacity than commodity-grade fluid.
Semiconductor capital expenditure tends to move in waves — roughly 3–5 years from trough to peak, driven by fab construction lead times and memory/logic demand cycles. When fabs are ramping, demand for specialty PDMS tightens noticeably, and suppliers have been known to allocate volume to incumbent buyers first. Spot premiums for electronics-grade material can run 15–35% above contract pricing during these windows, depending on how tight total production is running. If your facility relies on spot purchases during a semiconductor upcycle, you’ll feel it.
Automotive: EV Battery Thermal Management
This one shifted from slow-moving to structurally significant between roughly 2021 and 2024. EV battery thermal management systems use silicone oil — particularly mid-viscosity grades in the 50–350 cSt range — for immersion cooling and heat transfer loops. It’s not an interchangeable application; the fluid has to meet specific dielectric and thermal stability requirements, which again narrows the qualifying supply pool.
The EV production ramp across Europe, China, and North America during 2022–2025 added incremental, sustained demand that didn’t exist five years ago. Unlike consumer electronics cycles, this demand doesn’t oscillate much quarter to quarter — it layers on top of existing demand and compresses available capacity for those specific viscosity grades. Buyers in unrelated industries (textile finishing, release agents) started seeing allocation friction they hadn’t experienced before, largely because of EV-driven tightening upstream.
Personal Care: High Volume, Price-Sensitive, Seasonal
Cyclomethicone and dimethicone for hair care and skin care are enormous volume consumers of silicone oil globally. These formulations are price-sensitive in a way that electronics applications simply aren’t — cosmetic formulators will reformulate or substitute if the price differential justifies it, which creates a demand elasticity that slightly dampens extreme price spikes in this segment.
That said, the post-COVID beauty market recovery in 2022–2023 drove a real tightening of cosmetic-grade silicone supply, with lead times at several distributors stretching from standard 2–4 weeks to 8–12 weeks at points during that period. Seasonal layering makes this worse: consumer goods companies typically finalize Q4 product launches in Q2–Q3, meaning silicone raw material orders bunch up between April and August. If your purchasing calendar doesn’t account for that, you’re buying into the most competitive window of the year.
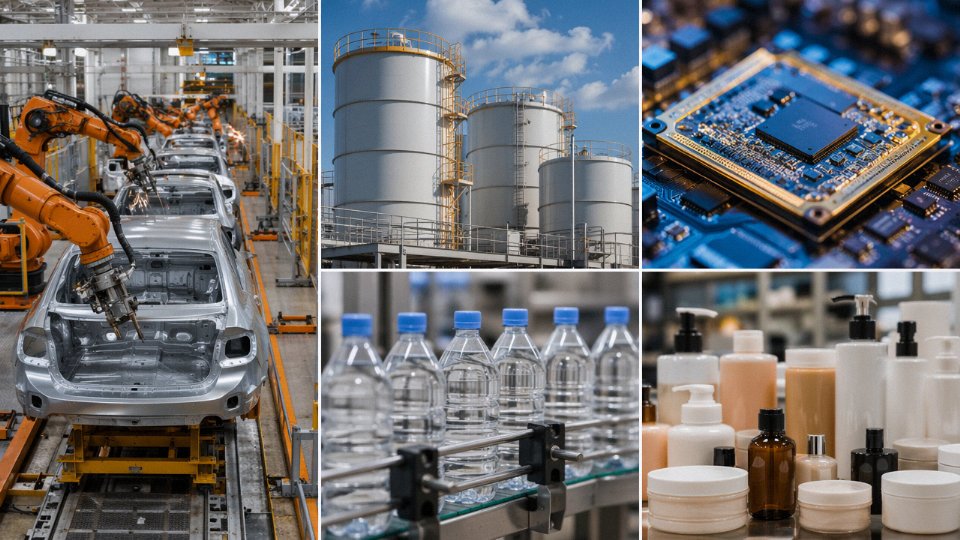
Construction: The Counterweight Effect
Silicone-based waterproofing compounds, sealant additives, and release agents for precast concrete track construction activity fairly directly. The prolonged slowdown in Chinese real estate from 2022 onward — a market that had consumed a substantial share of construction-grade silicone — partially offset demand growth from infrastructure spending elsewhere. In practice, this acted as a pressure release valve during a period when electronics and automotive demand were both pulling hard. Without that construction softness, overall silicone oil pricing in 2022–2024 would likely have been tighter than it was.
The Chinese real estate slowdown in 2022–2024 partially offset global silicone oil demand growth from EV and electronics sectors.True
Construction-grade silicone oil demand in China contracted as property development slowed, which moderated overall market tightness even as electronics and automotive applications grew — a portfolio effect documented by silicone industry analysts and visible in PDMS spot price behavior during that period.
Medical and Pharmaceutical: Low Volume, Acute Spikes
USP-grade silicone oil for syringe lubrication and medical tubing is a small fraction of total silicone oil volume, but the supply chain is tight and the qualification requirements are strict. Suppliers can’t easily redirect industrial-grade capacity to fill medical-grade demand; the documentation and validation requirements alone create a lag of months.
During 2020–2021, syringe demand for COVID vaccination programs created an acute shortage of medical-grade silicone lubricant. Spot premiums of 30–60% above pre-pandemic contract pricing were reported by procurement teams in the medical device sector — and because qualification switching costs are high, buyers couldn’t simply go find another supplier. That’s the defining feature of medical-grade demand: low volume but nearly inelastic, so when supply hiccups, the price response is disproportionate.
What This Means for Purchasing Strategy
The practical implication of this multi-sector demand structure is that silicone oil pricing rarely moves for one clean reason. Usually two or three sectors are pulling simultaneously, in different directions and at different intensities. Buyers who track semiconductor capex announcements, EV production forecasts, and construction PMI indices alongside their own demand signals will catch inflection points 2–3 quarters earlier than those who only watch their own category. It’s not perfect foresight, but it’s a real edge in contract timing.
Supplier Concentration, Contract Structure, and Volume Pricing Mechanics
The global PDMS supply chain is, bluntly, an oligopoly. Dow, Wacker Chemie, Shin-Etsu Chemical, Momentive, and Elkem Silicones collectively hold somewhere between 70 and 80% of nameplate global capacity — and that figure has held roughly stable for a decade despite considerable downstream demand growth. What that means in practice: when any two or three of those producers simultaneously tighten allocation, the entire market feels it within a quarter. Buyers who have not thought carefully about contract structure find this out the hard way.
Five major producers — Dow, Wacker Chemie, Shin-Etsu, Momentive, and Elkem Silicones — collectively control approximately 70–80% of global PDMS nameplate capacity.True
This concentration is documented across multiple industry capacity analyses and is consistent with published production volumes from these companies. The exact share shifts slightly year to year but the oligopolistic structure is well established.
How Volume Tier Determines the Price You Actually See
Tiered pricing in silicone oil is not subtle. A buyer pulling less than 1 MT per month is almost certainly buying through a distributor at spot or near-spot pricing — typically 15 to 30% above what a direct contract buyer pays for the same drum of 350 cSt industrial-grade PDMS. That’s not a punishment for being small; it’s just the economics of distributor inventory, working capital, and the handling cost of small orders. For specialty or cosmetic-grade material in quantities below 500 kg, distribution is often the only realistic channel anyway, and you simply price that in.
Once annual committed volume crosses roughly 50 MT, most of the major producers will entertain a framework supply agreement with meaningful pricing structure: discounts in the 10–20% range off standard list, annual price escalation caps tied to an agreed index (silicon metal spot, energy costs, or a blended formula), and some degree of volume flexibility. The specific discount depends heavily on grade, the buyer’s payment history, and frankly how much the supplier wants to keep that account — not just raw volume.
Spot vs. Contract: The 2021 Lesson
During 2021 and into early 2022, spot prices for industrial-grade PDMS in some regions ran 40 to 100% above prevailing contract prices. Buyers with locked-in annual agreements were, in some cases, sitting on material significantly below replacement cost. That kind of dislocation gets remembered. The opposite condition also exists: in a loose market, spot can drift below contract list price, which makes contract flexibility clauses — specifically, provisions allowing the buyer to reduce committed volumes by 15 to 20% without penalty — genuinely valuable. Most procurement managers only think to negotiate those clauses after they’ve been burned by over-commitment once.
Negotiating Take-or-Pay Terms Without Overexposing the Business
Take-or-pay language in silicone supply agreements is common above certain volume thresholds. The floor/ceiling structure — where the buyer commits to purchasing a minimum quantity but retains the right to buy up to a higher ceiling at the contract price — is usually the right framework. In practice, a floor set at 70 to 80% of expected consumption, with a ceiling at 120%, gives reasonable protection against both a production slowdown and an unexpected demand spike. Getting that range accepted requires the supplier to trust your forecast. That trust is built before the negotiation, through consistent ordering history and early communication when volumes shift.
Chinese Producers as a Structural Negotiating Lever
Wynca Group, Hoshine Silicon, and Dongyue Group have added real capacity at the commodity end of the market over the past several years. Their pricing on standard industrial grades — undifferentiated 50 to 1000 cSt PDMS in bulk — is often 10 to 25% below Western major list prices, depending on shipping, tariff regime, and payment terms. This matters even if you never actually buy from them. A credible, documented quote from a qualified Chinese supplier gives a procurement manager genuine leverage in annual contract renegotiations with a Western major. Suppliers know when a buyer has done that homework and when they haven’t. The buyers who haven’t tend to pay more.
| Buyer Profile | Typical Channel | Price Premium vs. Direct Contract |
|---|---|---|
| 50 MT/year, annual contract | Direct manufacturer | Baseline (with 10–20% discount from list) |
| Specialty grade, < 500 kg/order | Distributor only | +20–40% or more depending on grade |
The premium tiers above shift with market tightness — the gaps narrow in loose markets, widen sharply when capacity is constrained.
Regulatory Compliance, Certifications, and Quality Assurance Costs Embedded in Price
Most procurement teams see the price gap between industrial-grade and medical- or food-grade silicone oil and assume it’s mostly a purity story. It’s not — or at least not entirely. A significant slice of that premium is paperwork, audits, testing infrastructure, and liability management. Understanding where those costs come from helps you avoid two expensive mistakes: over-specifying and paying for compliance you don’t need, or under-specifying and discovering the problem mid-batch.
REACH Registration and SVHC Compliance
Any manufacturer selling silicone oil into the EU market above the one-tonne-per-year threshold carries a REACH registration burden. Maintaining a full chemical safety dossier — substance identity, hazard assessment, exposure scenarios, downstream use documentation — is not a one-time exercise. It requires ongoing updates as ECHA guidance evolves, and the cost scales with how many variants and formulations a supplier registers. In practice, compliance overhead is estimated to add roughly USD 0.10–0.50/kg to the delivered price, with the lower end applying to high-volume commodity grades where that fixed cost is spread thin, and the upper end hitting specialty or low-volume products hard.
SVHC screening adds another layer. As ECHA’s candidate list expands, suppliers must continuously recheck their formulations and supply chain inputs. Cyclic siloxanes D4 and D5 were already flagged; D6 restrictions followed. Any supplier who hadn’t proactively tracked these changes faced reformulation costs mid-contract — and passed them on.
Medical-Grade: The USP Class VI and ISO 10993 Premium
This is where compliance cost becomes structurally significant. USP Class VI and ISO 10993 biocompatibility testing requires third-party laboratory work: cytotoxicity, sensitization, irritation, and systemic toxicity studies. GMP facility certification means dedicated manufacturing suites, validated cleaning procedures, and continuous batch documentation. A single product qualification run can cost a manufacturer anywhere from USD 50,000 to well over USD 150,000 before a kilogram reaches a customer — the exact figure depends on the test panel required, the contract laboratory, and whether new facility audits are needed.
Those fixed costs get amortized across relatively small production runs, which is precisely why pharmaceutical-grade silicone oil trades at USD 8–18/kg compared to USD 3–5/kg for standard industrial material. It’s not that the molecule is fundamentally different. It’s that every batch carries a certificate of conformance, a full test record, and implicit liability coverage.
Medical-grade silicone oil contains a fundamentally different polymer structure than industrial-grade PDMSFalse
The base polydimethylsiloxane chemistry is essentially the same. The price premium reflects compliance testing, GMP manufacturing overhead, batch documentation, and third-party certification costs — not a chemically distinct molecule.
Food Contact and the Migration Testing Requirement
Silicone oil used in food processing equipment, mold-release agents, or food-grade lubricants must comply with FDA 21 CFR 175.300 in the US market and EU Regulation 10/2011 for European supply. Both frameworks require not just controlled synthesis — limiting catalyst residues, specific monomer purity thresholds — but also migration testing against food simulants. That testing is time-consuming and not cheap. Realistically, food-contact compliance adds 20–40% to the base price, and the range depends on how many food simulant categories the application spans and whether the customer requires a full migration report or accepts supplier self-declaration backed by formulation data.
ESG Documentation and the Supply Chain Audit Burden
This one has crept up on suppliers faster than most anticipated. Large OEM customers in automotive and electronics — the kind buying tens of tonnes annually — now routinely require conflict mineral declarations, Scope 3 carbon footprint disclosures, and third-party ESG audit reports as part of approved-vendor qualification. Silicone oil suppliers serving those customers have had to build internal teams or hire consultants to generate and maintain that documentation. Those costs are real operational overhead, and they flow into price — usually subtly, through a slightly higher list price or a reduced willingness to discount on spot orders, rather than a line-item surcharge.
Counterfeit and Adulteration Risk: The Hidden Cost of Cutting Corners
In price-sensitive markets, blending mineral oil or lower-viscosity silicone fractions into nominal-grade PDMS is a documented practice. Viscosity targets can be hit while the polymer chain length distribution, thermal stability, and dielectric properties all degrade. The consequences range from accelerated seal wear in hydraulic systems to failed electrical potting compounds to rejected cosmetic batches — each scenario far more expensive than the per-kilogram savings from the cheaper source.
Paying for a supplier who maintains third-party CoA verification, retains retention samples, and submits to periodic audits is a real cost embedded in price. It’s also insurance against a quality failure that typically costs 10–50x the per-kilogram premium to remediate once it’s in-process or — worse — in the field.
Practical Price Benchmarking: How to Evaluate Whether a Quote Is Competitive
Getting a quote for silicone oil is easy. Knowing whether it’s any good is a different problem entirely, and one that trips up even experienced procurement teams — especially when they’re comparing offers from a Chinese bulk supplier, a European distributor, and a domestic stockist simultaneously.
Specify Before You Price
This sounds obvious. It rarely gets done properly. Before requesting quotes, lock down viscosity grade (cSt at 25 °C, not a vague range), purity tier, whether you need functional modification (amino, epoxy, hydroxyl-terminated, etc.), packaging format, and any certification requirements — USP, REACH compliance, food-contact, whatever your end application demands.
Why does this matter financially? A 350 cSt industrial PDMS in 200 L drums is not the same product as 350 cSt in an IBC, even at the same factory gate price. Drum pricing typically runs USD 0.30–0.70/kg higher than IBC once you factor in container cost and filling time, and some smaller suppliers quote drum price while quietly shipping in recycled drums that introduce contamination risk. Specify packaging format explicitly and ask for the drum specification in writing.
Build a Real Landed-Cost Model
Factory-gate price is a starting point, not a delivered cost. The actual number that matters is: factory-gate price + ocean or road freight + applicable import duties and tariffs + port and customs handling fees + domestic last-mile delivery + currency hedge cost. For a US buyer importing from China at current tariff levels, the landed cost on standard industrial-grade PDMS can run 25–45% above the FOB quote, depending on HS code classification, freight lane, and whether you’re hedging the CNY/USD exposure. That’s not a rounding error.
Work out the landed cost model before comparing quotes across geographies. A European supplier quoting USD 5.20/kg ex-works Frankfurt may genuinely undercut a Chinese supplier quoting USD 3.80/kg FOB Shanghai once you run the full arithmetic.
Cross-Reference Against Published Indices
ICIS, ChemAnalyst, and Asian Metal all publish periodic assessments for silicone intermediates and finished fluids. These are not perfectly granular — ChemAnalyst’s PDMS assessments, for instance, tend to lag spot moves by a few weeks — but they give you a defensible reference point. If a supplier quote sits more than 15–20% below the current ICIS assessed range for the equivalent grade, that’s a flag, not a bargain.
Published price indices like ICIS and Asian Metal can be used as objective benchmarks to validate or challenge silicone oil supplier quotes.True
ICIS and Asian Metal publish regular price assessments for silicone intermediates including PDMS. While these indices have reporting lags and may not capture niche grades precisely, they are widely used in industrial procurement as credible third-party market references.
Price-to-Performance for Functional Grades
A commodity-grade silicone oil that technically meets the spec on paper may cost more in practice than a higher-priced functional grade. A textile finisher running amino-modified silicone oil at USD 12/kg but achieving equivalent softness hand-feel at 30–35% lower add-on rate is almost always better off economically than running a USD 7/kg general-purpose grade at higher application volume. Run the use-cost calculation, not just the purchase price comparison. This matters less for transformer cooling oil, where you’re buying a fluid in volume; it matters a lot in surface treatment and personal care.
Monitor Upstream as a Leading Signal
Silicon metal spot prices — trackable on Asian Metal and Metal Bulletin — typically lead finished PDMS prices by roughly 4–12 weeks, depending on supplier inventory positions and contract run-off. Chinese electricity tariff adjustments and methanol price movements (methanol feeds chloromethane synthesis upstream) are secondary signals worth watching quarterly. If silicon metal has moved up 15% in the past six weeks and your supplier hasn’t mentioned a price adjustment, either they’re running down buffer stock or something else is off.
Red Flags in Low-Priced Quotes
Absence of a third-party Certificate of Analysis. Refusal to disclose the manufacturing origin. Viscosity tolerance stated as ±15% or wider. HCl content above the spec limit for your application. Any one of these should trigger a second look; two or more and you’re probably looking at off-spec or adulterated product. In practice, off-spec silicone oil in a hydraulic damper or a cosmetic emulsion creates downstream problems that cost far more than the per-kilogram price savings justified.
Recommended Procurement Structure
Split the volume. Lock 65–75% of baseline annual demand into a longer-term contract with a tier-one producer — Wacker, Shin-Etsu, Momentive, Elkem, or equivalent — for supply security and predictable pricing. Reserve the remaining 25–35% for spot or short-term purchases through a qualified distributor, which gives you flexibility to capitalize on price dips and manage seasonal demand swings without renegotiating the main contract. This isn’t novel advice, but it’s surprising how many mid-sized buyers either go all-spot (and get squeezed in tight markets) or all-contract (and pay above-market when prices fall). The split structure balances both risks.
Frequently Asked Questions About Silicone Oil Pricing
Why did silicone oil prices spike so dramatically in 2021–2022, and could it happen again?
Three things hit at once: Chinese provincial authorities began rationing electricity to industrial users in late 2021, which cut silicon metal output — the upstream feedstock that everything else depends on — just as post-COVID demand in personal care and consumer electronics rebounded sharply. Simultaneously, container shipping rates were at historic highs and lead times had roughly doubled. No single factor would have caused the scale of the spike alone. Together they created a supply crunch that pushed PDMS spot prices in some markets to multiples of their pre-pandemic levels.
The structural conditions that made it possible are still in place. China produces something in the range of 60–70% of global silicon metal, and that production remains heavily exposed to regional power availability and policy decisions. Energy-intensive industries in Yunnan and Sichuan provinces are periodically curtailed when hydropower reservoirs run low — which is a seasonal, repeatable risk, not a one-off. Buyers sourcing critical grades should treat 60–90 days of safety stock as a minimum, not a luxury. It is not expensive insurance relative to the cost of a production stoppage.
Is higher viscosity silicone oil always more expensive?
No, and this surprises a lot of purchasing teams. Mid-range grades — roughly 100 to 1,000 cSt — are manufactured in the largest volumes and typically carry the lowest cost per kilogram, often sitting near the bottom of the industrial-grade PDMS price range. Very low viscosity grades (under about 10 cSt) require tight fractionation to isolate short-chain oligomers, which adds process cost. Ultra-high viscosity gums at the other extreme need extended polymerization cycles and specialized transfer and handling equipment. Both ends of the viscosity spectrum carry production premiums for different reasons. If your application can tolerate a 350 cSt or 1,000 cSt grade, you are usually in the most competitive part of the market.
How much cheaper is Chinese-origin silicone oil compared to Western producers?
Under normal market conditions, factory-gate pricing for Chinese commodity-grade PDMS typically runs 20–40% below equivalent Western material — the spread depends on the specific grade, order volume, and prevailing energy costs in China. Where the calculation gets more complicated is on the landed-cost side for US buyers. Section 301 tariffs on silicone products range from 7.5% to 25% depending on classification, and when you stack in ocean freight (which has remained volatile), marine insurance, and currency hedging costs, the effective delivered price advantage compresses to somewhere in the 5–15% range. For high-specification grades — pharmaceutical, food-contact, or aerospace applications — some Chinese producers still cannot offer equivalent third-party certifications, so the cost comparison becomes somewhat academic. Always model the full landed cost, not just the unit quote.
US Section 301 tariffs on silicone oil products range from 7.5% to 25% depending on product classification.True
Section 301 tariffs applied to Chinese chemical imports, including silicone-based products under relevant HTS codes, were established in 2018-2019 USTR actions and have been maintained through subsequent reviews, with rates varying by specific product classification.
Can silicone oil be substituted with mineral oil or PAO to reduce cost?
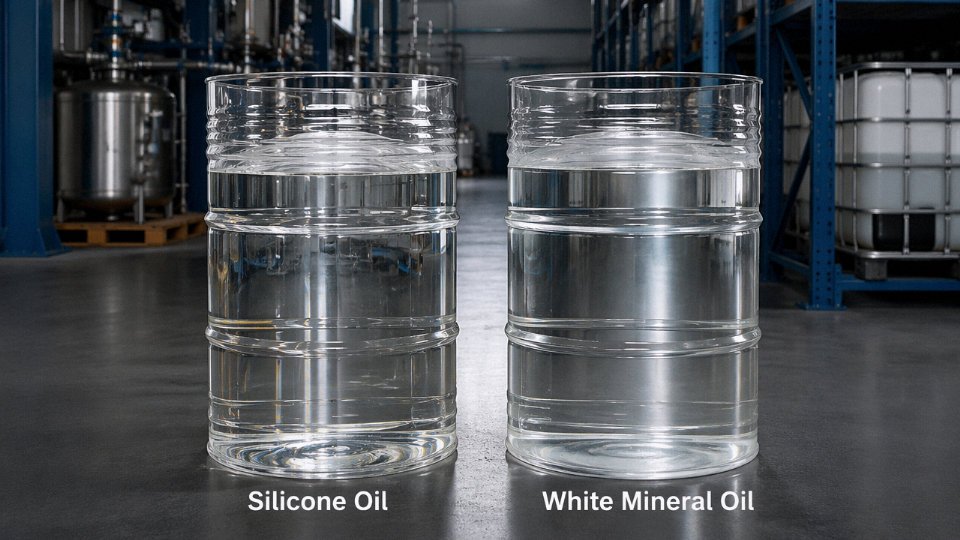
For some applications, yes. Mineral oil runs roughly USD 0.80–1.50/kg versus USD 3–6/kg for standard PDMS — that gap is real. But silicone oil’s thermal stability across roughly -60 °C to 200 °C or beyond, combined with its hydrophobicity, low surface tension, and physiological inertness, is not replicated by either mineral oil or PAO in applications where those properties actually matter. In practice, substitution attempts made purely on cost grounds, without full re-validation, have caused seal compatibility failures, viscosity shift at operating temperature, and regulatory rejection on certified products. If you are going to substitute, test thoroughly — do not rely on datasheet comparisons alone.
Do silicone oil prices follow crude oil the way mineral oils do?
Only weakly and indirectly. The primary cost driver is silicon metal, a metallurgical commodity priced off quartz ore, energy, and smelting capacity — none of which are petroleum-linked. Natural gas prices do enter the picture through methyl chloride, a co-feedstock in chlorosilane synthesis, which creates a secondary gas-price correlation. But the overall relationship with crude oil is loose enough that silicone oil functions as a partial hedge against petroleum price swings for formulators with mixed fluid portfolios. Do not expect silicone oil to cheapen when oil falls.
What is the typical lead time, and how does urgency affect price?
Standard industrial grades from a major distributor’s stock usually ship within one to three weeks. Specialty grades — certified pharmaceutical, high-purity electronic, or unusual viscosities — can require six to twelve weeks from manufacture, and that assumes the producer has the run scheduled. Spot purchasing during tight supply periods routinely adds 20–50% to contract pricing, sometimes more. That premium alone justifies the working capital cost of carrying a modest strategic inventory for any grade that is difficult to substitute or that feeds a critical production line.
Are silicone oil prices expected to rise or fall over the next few years?
The honest answer is: modestly upward for commodity grades, with more variability on specialty grades. EV thermal management applications are a genuine and growing demand driver. Environmental compliance costs — wastewater treatment, emissions controls on chlorosilane plants — are rising across all producing regions and do not get absorbed without flowing through to price. On the downside, new capacity additions in China and emerging capacity in the Middle East will provide some counterbalancing supply pressure, and a slowdown in construction silicone sealant demand could soften mid-range grades. A working forecast of 2–5% annual price inflation for standard industrial PDMS is consistent with most industry outlooks, though any repeat of the multi-factor supply shock scenario described above would override that baseline quickly.