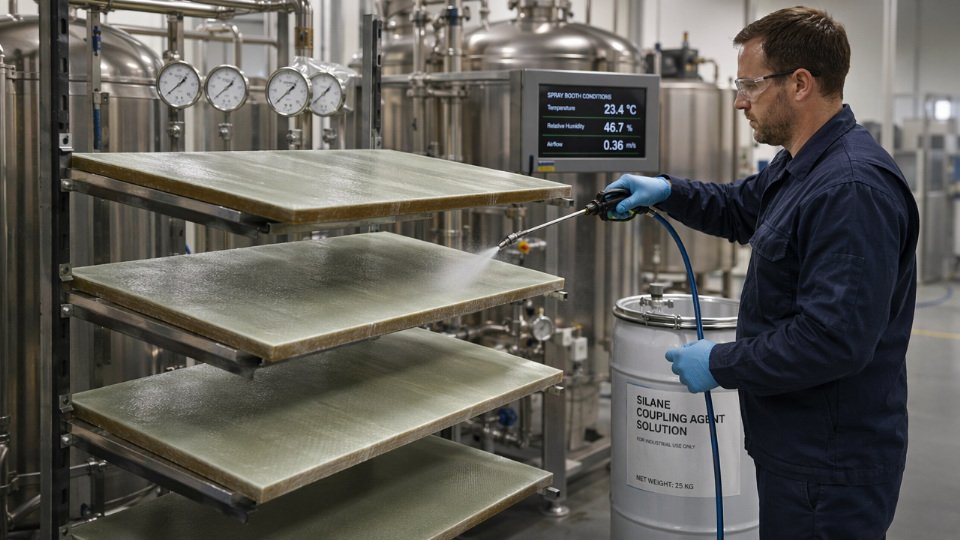
Silane coupling agents fail quietly. A batch that passes supplier certificate checks can still produce delamination at six months, fiber pull-out under cyclic load, or coating blistering after the first wet season — and by the time those failures surface, the root cause has been buried under subsequent production lots. Tracing the problem backward costs far more than the silane itself: warranty claims, rework labor, scrap composite panels, and occasionally a full process requalification that runs into weeks of downtime.
The primary methods used to assess silane coupling agent performance and durability include hydrolysis kinetics testing, pull-off and lap-shear adhesion measurement, contact angle and surface energy analysis, XPS or FTIR surface characterization, and accelerated weathering protocols such as QUV or Xenon arc exposure per ASTM G154/G155. Together these methods evaluate both the chemical bonding mechanism and the long-term stability of the silane interphase under real service stresses.
What makes silane testing genuinely difficult is that no single test tells the whole story. Hydrolysis rate governs whether the silane can even form a reactive silanol layer before it either polymerizes in solution or evaporates off the substrate — yet a silane with perfect hydrolysis behavior can still produce a weak interphase if the condensation step is incomplete or the organo-functional group is mismatched to the polymer matrix. The tests covered in this article are sequenced the way an experienced process engineer would actually use them: from incoming material verification through surface preparation validation and out to long-term durability qualification.
Chemical Characterization Methods: Confirming Purity, Structure, and Reactivity Before Application
Before a silane coupling agent ever touches a substrate, you need to know exactly what you’re working with. Incoming material that looks correct on a certificate of analysis can still carry enough partially hydrolyzed oligomers or isomeric impurities to undermine adhesion performance or destabilize a working solution within hours. The analytical methods below form the upstream quality gate — the point where you confirm identity, purity, and reactivity rather than discovering problems downstream as scrap or delamination.
Gas Chromatography and GC-MS for Purity Assay
GC remains the workhorse for silane purity assurance. Industrial-grade silanes for rubber compounding, coatings, or adhesives typically require ≥97% purity by GC area normalization; electronics-grade materials used in semiconductor packaging or printed circuit board coupling demand ≥99%, sometimes tighter. The difference matters because partially hydrolyzed dimers and trimers that co-elute near the main peak can skew concentration calculations and consume reactive sites unpredictably on the substrate surface.
Column selection is not trivial. Closely eluting positional isomers — common in aminosilane or mercaptosilane synthesis — require a mid-polarity capillary column (DB-1701 or equivalent) with a carefully programmed temperature ramp, typically 40–220 °C at 8–12 °C/min, to achieve adequate resolution without thermally degrading sensitive organofunctional groups in the injection port. GC-MS confirmation identifies unknown impurity peaks and flags solvent residues such as methanol or ethanol that accumulate during synthesis or storage.
FTIR: Functional Group Identity and Hydrolysis Monitoring
FTIR gives you structural fingerprints quickly, which is why most quality labs run it as the first check on a new lot. The Si–OCH₃ and Si–OC₂H₅ stretching vibrations appear in the 1080–1190 cm⁻¹ region; their intensity directly reflects how much reactive alkoxy functionality remains intact. If you’re evaluating a pre-hydrolyzed silane solution or a silane that has been in storage, watch for the Si–OR band shrinking while Si–OH (broad absorption near 3200–3500 cm⁻¹) and Si–O–Si condensation bands around 1000–1050 cm⁻¹ grow. A lot showing advanced Si–O–Si formation before it’s even applied has already lost a significant fraction of its crosslinking potential.
Organofunctional groups each have characteristic absorptions: primary amine N–H stretches around 3300–3380 cm⁻¹ for APTES, epoxy ring deformation near 910 cm⁻¹ for GPTMS, methacrylate C=O near 1715 cm⁻¹, vinyl C–H out-of-plane near 960 cm⁻¹, and S–H stretch around 2560–2590 cm⁻¹ for mercaptosilanes. Any unexpected peak, or an expected peak that’s shifted or absent, is grounds for quarantine and supplier investigation — not tolerance.
NMR Spectroscopy: Structural Confirmation and Condensation State
¹H-NMR confirms spacer chain length and functional group connectivity. ²⁹Si-NMR is more diagnostic: it resolves the T-notation states (T⁰ = monomeric, T¹ = one siloxane bond formed, T² = two, T³ = fully condensed) in pre-hydrolyzed solutions. A working silane primer intended for ambient-temperature application should show predominantly T⁰ and T¹ species. High T² and T³ content means the material has already undergone significant self-condensation and will form a thick, poorly adherent siloxane film rather than a well-organized monolayer or thin coupling layer on the substrate.
29Si-NMR is the most reliable single technique for quantifying the condensation state of a pre-hydrolyzed silane solutionTrue
29Si-NMR directly resolves T0 through T3 species with distinct chemical shifts, providing quantitative condensation state data that GC, FTIR, and viscosity measurements cannot replicate with the same specificity.
Hydrolysis and Condensation Kinetics
Knowing that a silane is pure is not sufficient — you also need to know how fast it reacts under your process conditions. pH-stat titration tracks alkoxide release in real time, yielding rate constants that let you predict pot life. Most trialkoxysilanes hydrolyze fastest between pH 3.5 and 5.5; outside this window, reaction slows considerably or condensation accelerates so fast the solution gels before it can be applied. Methoxy silanes hydrolyze roughly 3–5× faster than ethoxy analogs at neutral pH, which matters enormously when choosing between APTES and its methoxy equivalent for a fast-cycle production line where working solution must stay stable across a full shift.
Temperature amplifies this effect sharply. A hydrolysis solution stable for four hours at 20 °C may become unusable within 45–90 minutes at 40 °C — a realistic plant-floor temperature in summer or near process heat sources.
Physical Property Checks as Incoming QC
Refractive index, viscosity, and specific gravity are bench-top checks that correlate with concentration and pre-condensation degree. APTES (3-aminopropyltriethoxysilane) in pure form has a refractive index near 1.420–1.422 and specific gravity around 0.940–0.946 g/cm³; deviations outside the supplier’s specification range trigger GC re-analysis. These checks are fast enough to run on every incoming drum, which GC-MS is not. Think of them as the filter that decides which lots get full analytical workup.
Thermogravimetric Analysis for Thermal Stability
For silanes going into high-temperature applications — rubber mixing above 160 °C, hot-melt adhesives, or filled thermoplastics processed at 200 °C and above — TGA is non-optional. Onset decomposition temperatures for common organofunctional silanes typically fall in the range of 180–280 °C, depending on the organic functionality; aminosilanes tend to be less thermally stable than vinylsilanes. TGA residue content after burnoff confirms the inorganic silica backbone fraction, which is useful for lot-to-lot consistency checks. A silane with an onset temperature below your compounding temperature will volatilize or degrade during mixing, generating voids, odor complaints, and adhesion failures that trace back to chemistry rather than processing error.
Surface Coverage and Bonding Quality: XPS, Contact Angle, and AFM Analysis
Knowing a silane has the right chemistry on paper means nothing if it never forms a proper covalent bond to your substrate. A physisorbed silane layer — one that has merely condensed onto the surface without reacting with hydroxyl sites — washes out in the first humidity cycle. The techniques below tell you whether the silane is actually anchored, whether the film is uniform, and whether you have a monolayer or a poorly consolidated multilayer that will delaminate under load.
X-Ray Photoelectron Spectroscopy (XPS / ESCA)
XPS is the gold-standard technique for distinguishing chemisorbed from physisorbed silane. The Si 2p binding energy shifts are diagnostic: a well-condensed Si–O–Si network appears at roughly 102.0 eV, while unreacted SiO₂ reference material sits near 103.5 eV. Residual Si–OH (incompletely condensed silanol) shows up as a shoulder between these positions — its presence is a direct predictor of hydrolytic instability, because those uncondensed sites are exactly where moisture attack initiates at the interface.
Beyond peak position, the C/Si/N/O atomic ratio lets you confirm monolayer stoichiometry. An aminosilane (3-APTES) monolayer on glass should deliver a predictable N:Si ratio near 1:1. Ratio values that run significantly high in carbon suggest multilayer buildup or contamination; ratios low in nitrogen suggest incomplete deposition or substrate-surface competition.
XPS can distinguish physisorbed from chemisorbed silane through Si 2p binding energy shiftsTrue
Physisorbed and chemisorbed silicon species have measurably different Si 2p core-level binding energies due to changes in the local oxygen coordination environment; this is well-established in surface science literature and routinely used in silane interface characterization.
The limitation is throughput. XPS requires ultrahigh vacuum, meaning it stays in the analytical lab, not on the production floor. Use it to validate your application conditions during process development, then rely on faster proxies — contact angle, primarily — for routine incoming-quality checks.
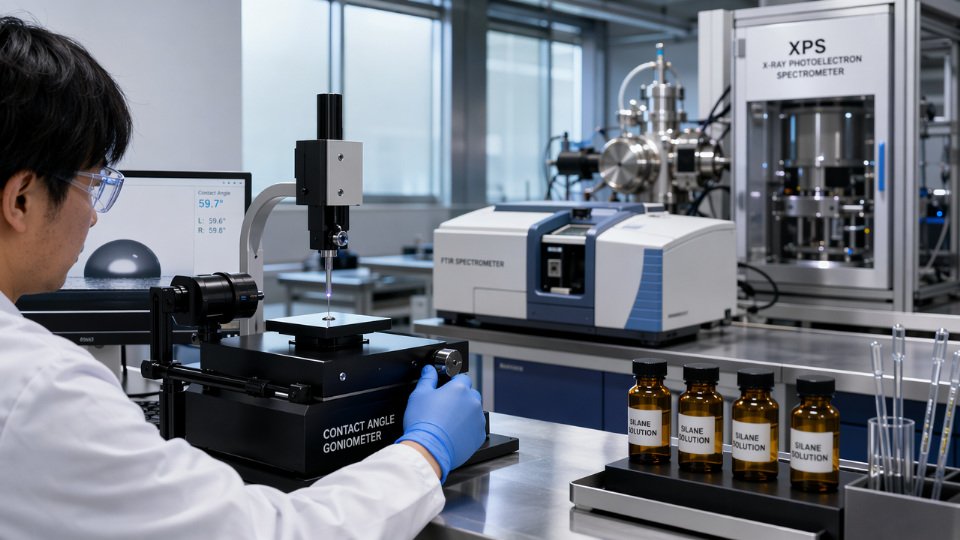
Water Contact Angle Goniometry
Contact angle measurement is the most scalable surface verification tool available. A glass panel or metal coupon goes under the goniometer in under two minutes. Untreated glass and metal oxides are hydrophilic, typically showing contact angles near 0–10°. After treatment with an amino or epoxy silane, those same surfaces shift to 40–60° — confirming that the organic functionality has oriented outward. Alkylsilane or fluorosilane treatments push WCA well above 100°, which is expected and correct for hydrophobic barrier applications.
The more informative measurement is the difference between advancing and receding contact angles, called contact angle hysteresis. A high hysteresis value (greater than 20–25° in many silane systems) signals surface heterogeneity — patchy coverage, multilayer islands, or contamination. A well-applied, uniform monolayer produces low hysteresis. If your incoming quality protocol only measures a static angle, you are missing that signal entirely.
Atomic Force Microscopy (AFM)
AFM gives you the film morphology story that contact angle cannot. A smooth monolayer produces roughness values (Ra) below 0.5 nm on a flat silicon wafer substrate. Multilayer islands — the typical consequence of over-concentration in the application bath or inadequate solvent conditions — appear as discrete raised domains, 5–20 nm tall, with Ra jumping to 2–5 nm or more. Those islands do not contribute to bonding strength. They create stress concentrations and preferential paths for moisture ingress.
The practical rule: if your AFM image looks like a topographic map with distinct mounds, your silane bath concentration or pH is out of range. Dial back concentration or adjust pH toward the 4–5 range where controlled hydrolysis and deposition occur for most trialkoxysilanes.
ToF-SIMS Depth Profiling and Ellipsometry
Time-of-flight SIMS adds depth information XPS cannot easily provide. For porous substrates — glass fiber, fumed silica — ToF-SIMS depth profiles show whether silane has penetrated into the pore structure or merely capped the outer surface. Silane that only sits on the exterior of a glass fiber bundle will be mechanically stripped during composite processing; penetration into the fiber sizing layer is what creates durable load transfer.
Ellipsometry on flat silicon wafer model substrates gives you film thickness directly. A covalently bonded silane monolayer typically measures 0.5–2 nm, depending on molecular size and tilt angle; the exact value depends on chain length and whether the alkyl or functional group is standing upright or lying oblique. Thickness values significantly above 2 nm on a wafer treated under standard conditions indicate multilayer deposition — a flag to revisit your process window.
Practical QC Scaling
For most production environments, a tiered approach works: contact angle goniometry as a daily incoming-quality check; XPS and AFM reserved for new substrate qualification, formulation changes, or failure investigations; ToF-SIMS pulled in when a delamination failure resists explanation by surface-level analysis. SiliconChemicals maintains reference XPS and contact angle datasets for standard substrates — glass fiber, aluminum alloy, and carbon steel — which customers can use to benchmark their own application processes against a known-good baseline rather than starting calibration from scratch.
Adhesion and Mechanical Interface Testing: Quantifying the Strength Gain at the Bond Line
Mechanical testing is where silane coupling agent performance stops being a chemistry question and becomes an engineering answer. Surface coverage confirmed by XPS is necessary but not sufficient — what matters on the plant floor is whether the treated interface carries load, survives cycling, and fails in the right mode. The tests described below are the standard toolkit for making that determination, each suited to a different substrate geometry and failure mechanism.
Pull-Off Adhesion Testing (ASTM D4541 / ISO 4624)
Dolly pull-off testing on coated steel or mineral substrates is often the first mechanical screen in a coating or primer qualification program. A steel dolly is bonded perpendicular to the prepared surface, cured, and loaded in pure tension until failure. The number most engineers record is peak load — but the failure mode is the more instructive output. Cohesive failure within the coating or adhesive layer means the interface exceeded the bulk material strength; adhesive failure at the silane-treated interface means the treatment is the weak link. A batch that shows 6 MPa pull-off with 100% cohesive failure is more durable than one showing 7 MPa with 60% adhesive failure at the primer-metal line, even though the peak load is higher.
Amino and epoxy silane pretreatments on grit-blasted or acid-etched steel routinely deliver 40–80% higher pull-off values compared to untreated controls, though the exact gain depends on silane concentration, cure temperature, and the specific primer system bonded on top.
Failure mode classification in pull-off testing is a more reliable predictor of long-term adhesion durability than peak load alone.True
Adhesive failure at the interface indicates incomplete bonding or poor silane coverage; cohesive failure confirms the interface strength exceeds bulk material limits, which is the target condition for durable coatings and primer systems.
Lap Shear Strength Testing (ASTM D1002 / ISO 4587)
Single-lap and thick-adherend shear tests evaluate silane performance in adhesive bond joints — the geometry most relevant to structural assembly. Common substrate combinations in industrial qualification work include aluminum-epoxy, glass-polyurethane, and carbon fiber-vinyl ester. Silane primer concentration matters significantly here: a 0.5–2.0 wt% solution in aqueous ethanol is the typical working range, with the optimum depending on substrate porosity and silane functionality. Go too dilute and coverage is sparse; go too concentrated and multilayer silane condensation builds up a weak, cohesively poor oxide-like layer that actually reduces shear strength. Optimizing this concentration is a real bench exercise, not a single-point assumption.
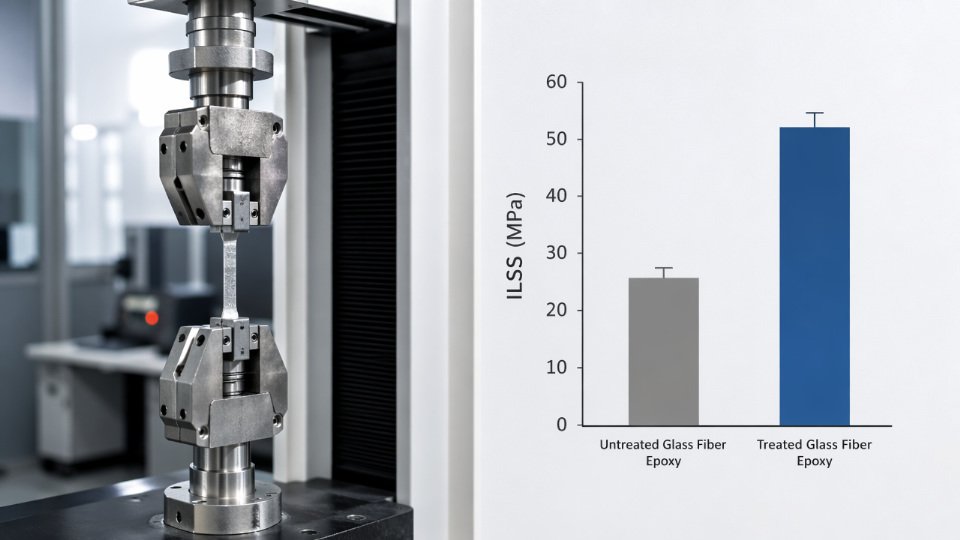
Short-Beam Shear and Interlaminar Shear Strength (ASTM D2344 / ISO 14130)
For glass-fiber and carbon-fiber reinforced polymer composites, interlaminar shear strength (ILSS) is the primary metric of silane coupling effectiveness. The short-beam shear test loads a small span-to-depth ratio beam in three-point bending, forcing interlaminar shear failure at the fiber-matrix interface. Untreated glass-fiber/epoxy laminates typically produce ILSS values in the 25–35 MPa range; silane-treated equivalents commonly reach 45–60 MPa, a 40–80% improvement that directly translates to fatigue life and damage tolerance in service.
Silane chemistry must match resin chemistry to realize this gain. An aminosilane primer paired with an epoxy matrix works well because the amine reacts into the epoxy cure network. Substituting a methacrylate silane into the same system without changing the cure chemistry leaves interfacial adhesion largely unimproved. This mismatch is a common and costly error in composite prepreg qualification.
Peel Testing (ASTM D1876, D903)
For flexible laminates, coated textiles, and film constructions, 90-degree and 180-degree peel tests measure interfacial fracture toughness in units of peel energy (J/m²) rather than simple force per width. Peel energy captures the work of crack propagation along the silane-treated interface, making it sensitive to adhesion quality across the entire bond area rather than just the highest-stress initiation point. Silane-treated flexible substrates typically show peel energy increases of 50–150% over untreated controls, with the range depending on substrate flexibility and peel rate.
Tensile and Flexural Testing of Filled Compounds (ASTM D638, D790)
In silica-filled rubber or mineral-filled thermoplastics, silane coupling agents improve stress transfer from the polymer matrix to filler particles indirectly — there is no discrete bond line to peel or shear. Tensile strength, elongation at break, and flexural modulus together tell the story. A well-treated fumed silica compound in a silicone rubber formulation typically shows tensile strength gains of 30–70% over unfunctionalized filler, with modulus increasing and tear resistance improving simultaneously.
Controlling the Confounding Variables
Substrate surface preparation is the largest source of test variability and the most common reason for irreproducible mechanical data. Grit blast profile, acid etch concentration and contact time, and any plasma or corona treatment must be fixed and documented before silane variables are changed. Application method — spray, dip, or wipe — and the drying and curing protocol after silane deposition must be standardized identically across specimens. A lab that changes two variables between test panels cannot attribute a strength difference to the silane alone. On a production line, this means written, version-controlled surface prep and silane application procedures tied directly to the test protocol used for qualification — not a general product datasheet recommendation applied informally.
Hydrolytic and Moisture Resistance Testing: Predicting Bond Durability in Wet Environments
Moisture is the primary enemy of silane-treated interfaces in service. Water molecules migrate to the bond line, compete with the silane for substrate hydroxyl sites, and — if the silane chemistry or application was suboptimal — cleave the interface progressively. Every other performance metric becomes irrelevant if wet durability fails, which is why moisture resistance testing deserves its own systematic protocol stack rather than a single checkbox.
Boiling Water Immersion
The oldest and bluntest tool in the kit remains one of the most informative. Specimens — typically lap-shear coupons or pull-off dollies on glass-fiber-reinforced laminates — are immersed in boiling deionized water for 2–8 hours, following ISO 62 or DIN 53495 variants depending on the matrix system, then tested wet or after a controlled dry-back period. The retained strength as a percentage of the dry baseline is the pass/fail index; most industrial specifications set a floor of 60–75% retention, though structural bonding applications often demand 80% or higher.
Why the spread? Silanes that form genuine covalent Si–O–substrate bonds — aminosilanes, vinylsilanes, epoxysilanes — resist hydrolytic displacement far better than silanes that have only physisorbed or self-condensed without anchoring to the substrate. A silane layer that looks identical by contact angle measurement but lacks dense covalent bonding will shed strength rapidly in the boiling test, often dropping below 40% retention within four hours. That failure mode is irreversible, not a drying artifact.
Methoxysilanes hydrolyze 3–5 times faster than their ethoxy analogs at neutral pH, making them more reactive during application but also more sensitive to premature hydrolysis in the bath.True
Hydrolysis kinetics of trialkoxysilanes are well established in organosilicon chemistry literature; the methoxy/ethoxy rate differential at pH 7 is consistently reported in this range and is attributable to the lower steric hindrance and better leaving-group character of methanol versus ethanol.
Humidity Cabinet Exposure
ASTM D2247 — 100% relative humidity at 38–50 °C — is the standard workhorse for sustained moisture exposure. Test durations run from 240 hours for routine quality screening up to 1000 hours for products targeting tropical infrastructure, marine, or building-envelope applications. Adhesion retention rate (%) measured at intervals of 240, 500, and 1000 hours maps the degradation kinetics rather than just a single endpoint, which matters when comparing two silane systems that both pass at 240 hours but diverge sharply at 500.
Crosslinkable systems — bis-silanes and polyfunctional silanes that form a three-dimensional siloxane network at the interface rather than a discontinuous monolayer — consistently show flatter degradation curves in this test. A densely crosslinked film resists water ingress by both chemical stability and physical tortuosity. Monolayer treatments on smooth metal surfaces, while sufficient for many dry applications, tend to show steeper adhesion loss beyond 500 hours in this environment.
Water Soak and Wet Adhesion Testing
Immersion at 23 °C or 70 °C for 7–28 days, followed by immediate wet testing, distinguishes reversible plasticization from true bond failure. Testing at 70 °C accelerates diffusion kinetics without the thermal artifact of boiling and is particularly relevant for under-hood automotive or process-equipment gasket applications. The protocol should always include a parallel dry-recovery arm: specimens dried 24–48 hours before testing. Recovery of 90% or more of original dry strength after drying suggests the moisture effect was primarily matrix-level plasticization; recovery below 70% points to genuine interfacial hydrolysis.
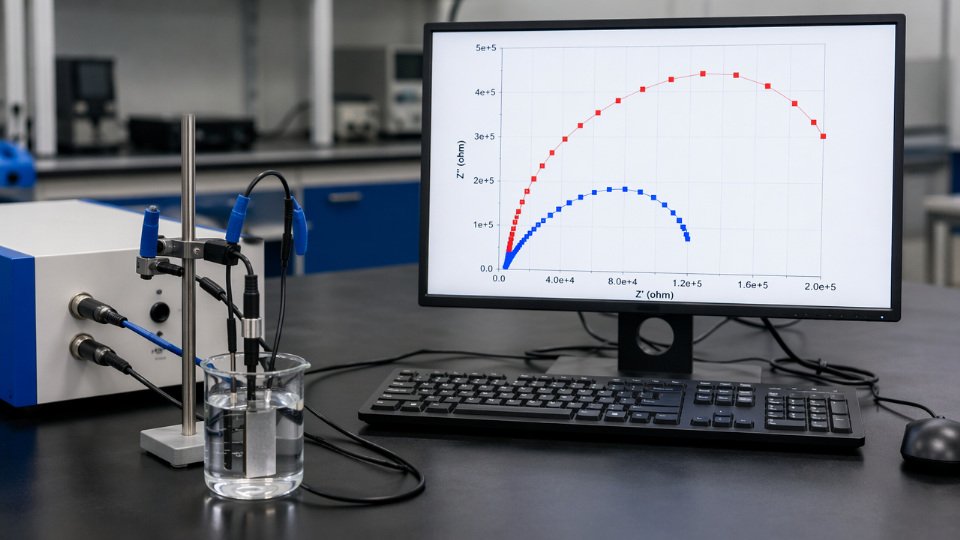
Electrochemical Impedance Spectroscopy on Metal Panels
EIS is the most mechanistically informative test in this group and is underused outside corrosion-protection R&D. Silane-treated steel or aluminum panels are immersed in 3.5% NaCl solution and impedance is monitored at intervals — typically 1, 24, 72, 168, and 500 hours. Coating resistance (Rc) for a well-applied silane primer on carbon steel starts above 10⁸ Ω·cm²; a drop below 10⁶ Ω·cm² within 72 hours signals either incomplete hydrolysis during application, insufficient cure, or inadequate surface cleanliness before treatment. Double-layer capacitance tracks water uptake directly. The slope of Rc degradation over time is often more useful than any single data point for ranking formulations.
Salt Spray Testing
ASTM B117 and ISO 9227 neutral salt fog exposure — run from 500 hours for light-duty specifications to 2000 hours for heavy industrial or marine primers — evaluates the silane’s function as a corrosion-inhibiting adhesion promoter on metal substrates. Panels are scribed through the coating to bare metal before exposure. Creep corrosion distance from the scribe and blister density away from it are measured at intervals. A well-formulated bis-silane pre-treatment on cleaned steel typically shows under 2 mm creep at 1000 hours; a poorly applied or wrong-silane-chemistry treatment on the same substrate can show 5–10 mm creep in the same window, with blistering starting as early as 200 hours.
The key mechanism: Si–O–metal bonds at the interface are thermodynamically susceptible to hydrolysis, particularly under alkaline conditions that develop at cathodic sites during corrosion. Polyfunctional silanes that crosslink laterally reduce the available pathways for water to reach those bonds. Monolayer films offer minimal barrier. This is why procurement decisions based solely on dry adhesion performance — without salt spray or EIS data — regularly produce field failures within the first service season in coastal or high-humidity environments.
Thermal and Thermomechanical Durability: Testing Silane Performance Under Heat and Cyclic Stress
Moisture is the most-discussed enemy of silane-treated interfaces, but heat — steady-state or cyclic — quietly accounts for a significant share of field failures in automotive underhood assemblies, power electronics encapsulants, and aerospace structural bonds. The two failure mechanisms often compound each other: a bond that survives 1000 hours of humidity exposure at room temperature may delaminate within weeks once operating temperature climbs above 130 °C. Getting thermal durability data right before production launch is not optional.
Dry Heat Aging: ASTM D3045 and IEC 60216 Protocols
Oven aging remains the most direct thermal screen. Specimens — bonded lap joints, short-beam shear coupons, or molded composite bars — are conditioned at temperatures ranging from 100 °C to 200 °C for exposure windows of 250 to 3000 hours, depending on the end-use temperature class and the lifetime target. Property retention at periodic pull-outs (typically 25%, 50%, and 100% of total exposure time) tracks tensile strength, flexural modulus, and direct adhesion pull-off.
The functional group on the silane matters enormously here. Aminosilanes retain meaningful coupling efficiency up to roughly 200 °C; their thermal stability derives from the relatively robust Si–C bond and the non-labile amine functionality. Methacrylate silanes begin losing performance above approximately 180 °C — the methacrylate ester linkage is the weak point, not the siloxane network itself. Selecting an aminosilane for a 175 °C continuous-use application versus defaulting to a methacrylate grade because it “worked in the coating” is a decision that dry heat aging data makes visible before it becomes a warranty claim.
Aminosilane-treated glass fiber composites generally retain higher adhesion strength after 1000 hours at 180 °C compared to methacrylate silane-treated equivalents under identical cure conditions.True
The thermal lability of the methacrylate ester group above 180 °C reduces effective coupling efficiency faster than the thermally stable Si-C and Si-N bonds in aminosilanes, a finding consistently reported in academic fiber-matrix adhesion studies and confirmed by composite property retention testing.
TGA-DSC: Quantifying Thermal Events in the Silane Layer
Thermogravimetric analysis coupled with differential scanning calorimetry gives you the oxidation onset temperature, weight loss profile, and the location of any exothermic decomposition events in the silane film or silane-loaded compound. This is particularly relevant in rubber processing, where internal mixer temperatures routinely reach 160–180 °C during silica compounding with bifunctional silanes like TESPT. A TGA run showing a sharp exotherm at 195 °C tells the process engineer they have a narrow thermal window and that dump temperature discipline is not negotiable. Weight loss curves also help separate physical desorption of unreacted silane from actual bond degradation — a distinction that contact angle or XPS alone cannot make dynamically.
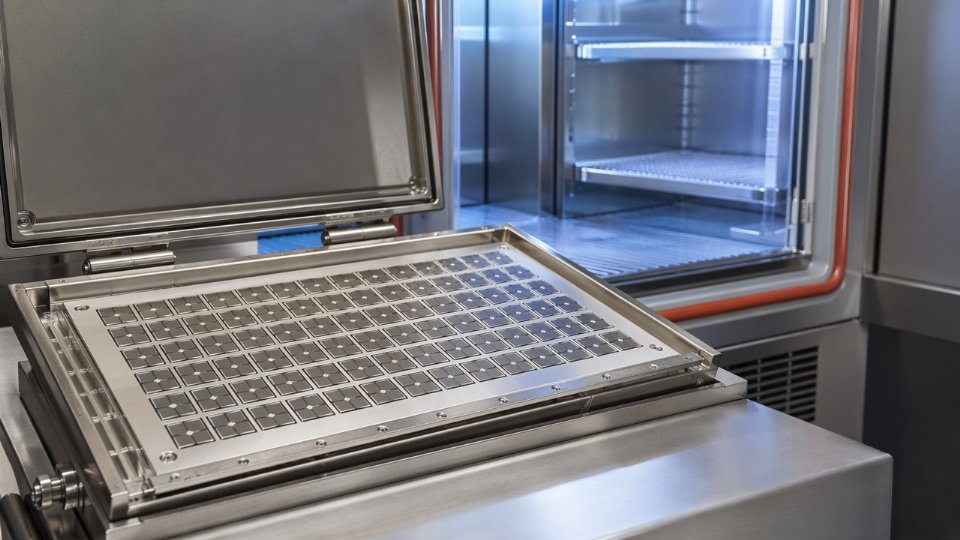
Thermal Cycling: Electronics and Automotive Protocols
For electronics packaging and underhood components, IPC-TM-650 method 2.6.7 and comparable automotive test specifications cycle specimens repeatedly between −40 °C and +125 °C or +150 °C, commonly running 500 to 1500 cycles. The damage mechanism is CTE mismatch fatigue rather than bulk thermal degradation: the silane-treated interface accumulates shear strain every cycle because the polymer matrix and metal or ceramic substrate expand and contract at different rates. Post-cycling evaluation uses cross-sectional SEM to detect micro-cracking at the interface and acoustic microscopy (C-SAM) to map delamination without destructive sectioning.
A useful internal benchmark: if adhesion retention after 1000 thermal cycles is below 70% of the pre-cycle baseline, treat that as a rejection criterion for demanding applications regardless of what room-temperature data shows.
DMA: Reading the Interface Through the Composite’s Mechanical Signature
Dynamic mechanical analysis measures storage modulus (E’), loss modulus (E”), and tan δ across a temperature sweep. A silane-treated fiber composite consistently shows a higher E’ plateau below Tg and a lower, narrower tan δ peak compared to an untreated control — both indicating that the silane interface is constraining polymer chain mobility near the fiber surface. The shift in Tg itself, typically 5–15 °C upward with effective silane treatment depending on fiber volume fraction and silane coverage, gives a semi-quantitative coupling quality index without requiring destructive mechanical testing. For development work comparing two silane candidates side by side, DMA is faster and more informative than running a full set of short-beam shear specimens at every aging interval.
TMA and CTE Mismatch Analysis
Thermomechanical analysis on bonded assemblies — particularly metal-to-polymer or ceramic-to-polymer joints — quantifies dimensional change as a function of temperature, allowing direct calculation of interfacial stress accumulation during thermal excursions. This guides silane selection when the goal is to buffer rather than simply bond: a more flexible silane interphase with a modulus gradient can redistribute CTE-driven stress and delay fatigue crack initiation. Skipping this step in joint design is a common source of premature failure in power module encapsulation, where the CTE difference between aluminum substrate and epoxy molding compound can generate interfacial shear stresses of several MPa per thermal cycle.
Arrhenius Lifetime Modeling: Translating Test Data Into Decisions
Accelerated thermal aging data from multiple temperature exposures feeds directly into Arrhenius-based lifetime prediction, using property retention versus time to extract an activation energy for the degradation process and project service life at actual use temperature. The practical output is a qualified service temperature ceiling with an associated confidence interval — exactly what qualification engineers need for PPAP submissions or material approval documentation. This modeling work requires at least three aging temperatures and careful attention to whether the degradation mechanism stays consistent across the range; a mechanism shift (e.g., oxidative degradation overlapping with hydrolytic effects at higher temperatures) invalidates a single linear Arrhenius extrapolation and demands bracketing with supporting data.
UV, Weathering, and Outdoor Durability Testing for Silane-Treated Surfaces and Coatings
Exterior applications are where silane coupling agents face their most punishing combined stress state: UV photons attacking the organofunctional group, moisture cycling through the interface, and thermal expansion working the bond line loose over years. A silane that performs beautifully in a dry lab pull-off test can fail catastrophically on a south-facing facade after two winters. Accelerated weathering protocols exist precisely to compress that failure timeline into something actionable before product launch.
Accelerated UV Weathering: ASTM G154 and Lamp Selection
The standard QUV cycle used for silane-treated coatings and adhesive bonds runs 8 hours of UV exposure at 60 °C followed by 4 hours of condensation at 50 °C, repeated continuously. Lamp choice matters more than most procurement specs acknowledge. UVA-340 lamps replicate the solar spectrum from roughly 295 nm upward and are the correct choice for exterior coating durability — they match the peak energy region that actually reaches the Earth’s surface. UVB-313 lamps are more aggressive and accelerate testing further, but they introduce short-wavelength energy not present in real sunlight, which can produce failure modes that never occur outdoors. Use UVB-313 for ranking or screening; use UVA-340 for correlation to real service life.
Exposure programs of 500–2000 hours are typical, depending on the claimed service life of the product. A 500-hour program is a reasonable minimum for interior-adjacent or partially sheltered applications; 1000–2000 hours is standard for exterior structural sealants and facade coatings where 5–10 year performance warranties are expected. Monitor at intervals — 250, 500, 1000 hours minimum — measuring color shift (ΔE in CIE Lab, where ΔE > 3 is typically visible to an end customer), 60° gloss retention, chalking by ASTM D4214 tape method, and pull-off or peel adhesion. Adhesion retention below 70% of the pre-exposure baseline at any checkpoint is a meaningful warning sign, not just a data point.
Xenon Arc Weathering: ASTM G155 and ISO 4892-2
Xenon arc testing replicates the full solar spectrum — UV, visible, and near-IR — which makes it the preferred method for construction sealants based on silane-crosslinked polymers and for glass-silane adhesive bonds used in curtain wall and facade glazing. The standard irradiance is set at 0.35 W/m² at 340 nm. Because xenon arc includes visible wavelengths that heat the specimen differently than QUV, color and gloss measurements from xenon arc tests correlate more reliably to real outdoor appearance changes. The trade-off is equipment cost and filter maintenance — xenon filters degrade and must be replaced on schedule or irradiance drift invalidates the dataset.
Natural Outdoor Weathering: ASTM D1435
Accelerated testing is always an approximation. Natural exposure at standardized test sites — Florida for hot-humid conditions, Arizona for high UV and dry heat — over 12 to 60 months remains the ground truth for exterior durability claims. Florida exposure is particularly aggressive for silane-treated interfaces because the combination of high humidity, UV intensity, and biological activity stresses every degradation pathway simultaneously. Arizona isolates photochemical and thermal degradation with minimal moisture contribution.
Accelerated QUV hours can be directly correlated to Florida outdoor exposure months for silane-treated substratesTrue
Correlation datasets exist for specific substrate-silane systems (e.g., glass and aluminum with aminosilane or epoxysilane primers), but the conversion factor varies by silane chemistry, substrate, and local climate. A single universal conversion ratio does not exist; substrate-specific reference data is required for valid extrapolation.
SiliconChemicals maintains reference correlation datasets linking QUV hours to Florida months for silane-treated glass and aluminum substrates, which allows customers to set realistic accelerated test targets rather than guessing at equivalency.
Photodegradation of the Si–C Bond
UV irradiation generates free radicals that attack the organic portion of the silane molecule, specifically the Si–C bond linking the organofunctional group to the silicon center. Vinyl silanes are particularly vulnerable because the double bond participates readily in radical chain reactions, accelerating degradation of the coupling function. Saturated alkylsilanes and silanes where the functional group is separated from silicon by a propylene spacer degrade more slowly under the same UV dose. For applications where the silane-treated surface will be directly exposed — rather than buried under a topcoat — UV-stabilized silane formulations incorporating hindered amine light stabilizer (HALS) chemistry or inorganic UV absorbers in the primer system extend functional service life meaningfully.
Functional Durability in Hydrophobic and Self-Cleaning Coatings
For fluoroalkylsilane and PDMS-silane hybrid coatings, water contact angle (WCA) stability over weathering exposure is the primary functional durability metric — maintaining WCA above 140° after 1000 hours of QUV is a credible benchmark for premium performance. Contact angle measurement at 250-hour intervals tracks the rate of hydrophobic function loss and allows early detection of silane depletion or topographic degradation before the surface becomes visibly compromised.
Cross-Referencing Weathering with Mechanical Adhesion
Neither UV degradation data nor mechanical adhesion data tells the full story in isolation. A coating can retain color and gloss through 1000 hours of QUV while losing 50% of its adhesion strength — the reverse is equally possible. For exterior structural applications, the assessment must run both measurements in parallel on the same sample set. The combination of adhesion retention below threshold and ΔE above the visibility limit at the same test interval is a clear rejection criterion. Treating these as separate pass/fail gates misses the interaction effects that govern real service life.
Rubber and Filled Polymer Compound Testing: Silane Performance in Tire and Industrial Rubber Applications
Rubber compounding consumes more silane coupling agent by volume than any other industrial sector worldwide. The dominant use case — precipitated silica reinforcement in passenger car tire treads — demands a testing stack that goes well beyond simple adhesion pull-off numbers. You are evaluating a reactive chemistry happening inside a viscous polymer melt at 140–160 °C, and the consequences of getting it wrong show up as fuel economy failures, wet grip deficits, or premature tread cracking rather than a delamination you can see on a lab bench.
Bound Rubber Content: The First-Pass Coupling Efficiency Indicator
Bound rubber is the fraction of polymer physically or chemically attached to the filler surface that cannot be extracted by a good solvent. The test is operationally simple: weigh an uncured compound sample, immerse it in toluene or cyclohexane for 72–96 hours at room temperature, remove the swollen gel, dry it to constant mass, and calculate the retained fraction. For silica-filled compounds using a bifunctional sulfur silane such as TESPT (bis[3-(triethoxysilylpropyl] tetrasulfide), bound rubber typically falls between 15 and 35%, depending on silica surface area, silane loading, and mixing temperature profile. Uncoupled controls — same silica, no silane — usually come in below 10%. That gap is your direct measure of grafting efficiency. If a new silane batch produces bound rubber of 11–12% where your qualified material gives 24–28%, you have either a purity problem in the silane, a mixing temperature deviation, or a silica moisture issue. The test catches all three indirectly and costs almost nothing to run.
Payne Effect Measurement: Reading the Filler Network
Dynamic oscillatory strain sweep on a rubber process analyzer (RPA-2000 or equivalent) is the standard tool here. You apply a sinusoidal strain ranging from roughly 0.1% to 100% at a fixed frequency (typically 1 Hz, 60 °C) and track storage modulus G’. The key output is delta G’ — the difference between G’ at low strain and G’ at high strain. A large delta G’ means strong silica-silica filler agglomerate networks persist in the compound, which in service translates to high hysteresis and poor rolling resistance. Effective silane coupling disrupts those networks by replacing silica-silica contacts with silica-polymer bonds, and well-coupled systems show delta G’ reductions of 50–80% relative to uncoupled controls. This single measurement correlates better with finished-tire rolling resistance than almost any other lab test at the compound stage.
Delta G' reduction of 50–80% in well-coupled silica-silane systems compared to uncoupled controls is consistently reported in open literature on TESPT/silica tire tread compounds.True
Multiple peer-reviewed studies and internal tire industry data confirm this range for bifunctional sulfur silanes at standard loading levels (6–10 phr TESPT on 60–80 phr silica). The exact magnitude depends on silica CTAB surface area and mixing protocol.
Cure Rheometry: Silane Effects on Vulcanization Kinetics
Moving die rheometry (MDR, ASTM D5289) monitors torque development during cure at a fixed temperature — typically 160–170 °C for tire compounds. The critical outputs are minimum torque ML (viscosity proxy), maximum torque MH (crosslink density proxy), scorch time ts2, and optimum cure time t90. Sulfur-functional silanes participate directly in the vulcanization network: the polysulfide groups on TESPT or the disulfide groups on TESPM release active sulfur under heat, contributing additional crosslinks between filler-bound silane and the polymer chains. This tends to reduce t90 and increase MH slightly compared to a mercapto-silane or non-reactive silane at equivalent loading. Procurement teams switching between TESPT and TESPM to manage cost need to understand that the disulfide analog releases sulfur faster — it can shorten scorch time by 15–30% at identical loading and processing temperature. Reformulating without rerunning MDR is a scrap batch waiting to happen.
Physical and Mechanical Properties of the Cured Compound
Tensile testing per ASTM D412, Shore A hardness per ASTM D2240, and tear strength per ASTM D624 provide the baseline performance fingerprint of the cured compound. For tire tread applications with precipitated silica at 60–80 phr and a sulfur silane at 6–10 phr, expect tensile strength in the 18–22 MPa range and 300% modulus between 8 and 12 MPa. Where those numbers land depends heavily on silica surface area (CTAB 150–200 m²/g versus 100–140 m²/g grades), silane type, and sulfur cure system design. A compound that passes bound rubber and Payne effect targets but falls short on 300% modulus — say, 6.5 MPa when the spec floor is 8 MPa — usually points to incomplete silanization in the mixer rather than wrong silane chemistry.
Dynamic Mechanical Properties: The Rolling Resistance / Wet Grip Balance
Tan δ measured by DMA or RPA at two temperatures defines the tire industry’s central performance trade-off. High tan δ at 0 °C predicts good wet grip; low tan δ at 60 °C predicts low rolling resistance. The entire rationale for silica-silane technology in “Green Tire” tread compounds is that it can deliver both simultaneously — unlike carbon black, which tends to couple rolling resistance and wet grip together in an unfavorable way. Effective silane coupling reduces tan δ at 60 °C by 15–30% relative to an uncoupled silica reference, without proportionally degrading the 0 °C value. When evaluating a new silane supplier, running DMA across both temperatures on a standardized reference compound is non-negotiable. A 5% shortfall in tan δ reduction at 60 °C at the compound stage translates directly to measurable rolling resistance regression in finished-tire coast-down testing.
Filler Dispersion Assessment: Seeing What the Chemistry Did
Even excellent silane chemistry fails if dispersion is poor. Optical microscopy of microtomed compound cross-sections, adapted from ASTM D2663 carbon black dispersion methodology, gives a rapid qualitative and semi-quantitative picture of silica aggregate size and distribution. TEM of ultramicrotomed sections resolves aggregate morphology at nanometer scale and is the definitive tool for research-grade work. X-ray computed tomography adds 3D filler network visualization without sectioning, which is valuable when you suspect localized agglomerate clustering that 2D sections might miss. Poor dispersion — visible aggregate clusters above 10–15 µm — almost always accompanies high Payne effect, low bound rubber, and depressed modulus simultaneously. The dispersion test does not replace those measurements; it explains them when they go wrong.
Corrosion Protection and Metal Substrate Performance Testing
Silanes are displacing chromate conversion coatings across automotive, aerospace, and industrial finishing lines — driven by RoHS and REACH restrictions on hexavalent chromium. That transition creates a serious testing burden. Unlike chromate, which is self-healing through soluble Cr⁶⁺ release, a silane pretreatment is only as good as the quality of its covalent Si–O–M bonds to the metal surface. No bond continuity means no barrier. Testing has to catch that early.
Electrochemical Impedance Spectroscopy: The Quantitative Barrier Fingerprint
EIS is the method most corrosion engineers reach for first because it gives a continuous picture of what is happening at the interface without destroying the sample. You immerse the silane-coated panel in 0.1 M NaCl, apply a small AC perturbation (typically 10 mV), sweep frequency from 100 kHz down to 10 mHz, and fit the resulting Nyquist or Bode plot to an equivalent circuit.
For a silane primer on steel, the relevant circuit elements are R_pore (ionic resistance through pores in the film), R_ct (charge transfer resistance at the metal surface beneath the coating), and — in later-stage spectra after the electrolyte has penetrated — a Warburg diffusion element representing mass transport to and from active corrosion sites. A well-formulated bis-silane system on grit-blasted cold-rolled steel will typically maintain R_ct above 10⁸–10⁹ Ω·cm² after 500 hours immersion, depending on film thickness uniformity, silane concentration during application, and cure temperature. If R_ct starts dropping sharply between the 168-hour and 336-hour readings, that is your early warning: moisture is reaching the metal faster than the bond line can sustain.
Track R_pore alongside R_ct. A film that still shows high R_ct but collapsing R_pore is absorbing water into the film bulk — a precursor to delamination even if active corrosion hasn’t started yet.
Potentiodynamic Polarization and Corrosion Inhibition Efficiency
Tafel plot analysis gives you scalar numbers that procurement and engineering management can compare directly across suppliers. Scan from −250 mV to +250 mV versus open-circuit potential, extract i_corr by Tafel extrapolation, and calculate inhibition efficiency as η% = (i_corr,bare − i_corr,treated) / i_corr,bare × 100. High-performance bis-silane pretreatments on aluminum alloy substrates — specifically systems with amino or mercapto functional groups that contribute additional metal complexation — routinely achieve η above 85–90% under these conditions. Amino-functional and bis-[triethoxysilylpropyl]tetrasulfide (TESPT-type) systems tend to outperform simple monosilane films on steel because the additional functional group interacts directly with the metal oxide layer rather than relying on siloxane condensation alone.
Bis-silane pretreatments can achieve corrosion inhibition efficiency above 90% on aluminum and steel substrates, measured by potentiodynamic polarization in 0.1 M NaCl.True
No explanation available.
amine and bis-[triethoxysilylpropyl]tetrasulfide systems on AA6061 aluminum and mild steel consistently report η values in the 85–95% range, depending on surface preparation and cure conditions. This is a well-established finding in corrosion science literature (e.g., Van Ooij group, University of Cincinnati; Zhejiang University surface chemistry studies).”]
Cross-Cut Adhesion: Wet Retention Is the Number That Matters
Dry adhesion ratings per ASTM D3359 or ISO 2409 are easy to pass. The cut pattern is applied through the topcoat to the substrate, tape is pulled, and the result is rated 0B–5B (or 0–5 in ISO terms). A silane-primed panel versus a degreased-only control will almost always show a clear difference in dry conditions — often 5B versus 2B or worse. Automotive and aerospace coating specifications typically demand 4B or 5B minimum.
The real discriminator is wet adhesion retention: 72 hours immersion at 40 °C, then immediate cross-cut test before the panel dries. Silane systems that pass dry adhesion but drop two rating levels after wet immersion are hiding a hydrolysis problem at the silane-metal interface. That failure mode shows up in field delamination 12–18 months into service, long after the part shipped.
Scribe Creep and Filiform Corrosion Testing
ASTM D2803 and the related ASTM B117 salt spray protocol measure lateral corrosion propagation from a deliberate coating breach — the most realistic scenario for a stone chip or a cut edge on a vehicle panel. You scribe through the entire coating system to bare metal, expose to 5% NaCl fog at 35 °C, then measure the width of corrosion creep from the scribe line at defined intervals.
For automotive OEM qualification of silane-pretreated aluminum panels, the common acceptance threshold is less than 1 mm average creep after 1000 hours of salt spray. Silane-only systems on AA5xxx or AA6xxx aluminum can meet this requirement when surface preparation is controlled — no more than 4 hours between etch and silane application, correct pH of the silane bath (typically 4.0–5.5 for hydrolysis without premature condensation), and oven cure above 80 °C. Exceed that window between preparation and treatment and the native oxide regrows; creep values can double.
Filiform corrosion is the related but distinct failure mode — fine thread-like corrosion tracks running laterally under the coating, common on aluminum in high-humidity environments. Silane pretreatments generally outperform simple phosphate-rinse systems on filiform resistance, but underperform chromate in sustained 85% RH conditions unless a zirconium or titanium co-complexant is added to the pretreatment bath.
Film Continuity: Where Over-Application Destroys the Corrosion Barrier
This failure mode is underappreciated in production environments. Silane films above roughly 50–100 nm — which can happen when bath concentration is too high, rinse is inadequate, or the part is withdrawn too slowly from a dip tank — develop internal stress on drying and crack. SEM cross-sections show classic mud-cracking morphology. Optical profilometry on the dried film surface quantifies crack density and depth.
Those cracks become direct electrolyte pathways to the metal. A panel that looks uniformly coated to the naked eye but carries a cracked silane film will fail EIS and salt spray testing faster than a bare metal panel, because the cracks concentrate electrochemical activity. Production QC should include periodic SEM checks on panels pulled from the line, particularly after any change in bath chemistry or line speed.
Where Silane Systems Stand Against Chromate Benchmarks
Honest comparative data matters here because the industry narrative sometimes overstates silane capability. Best-in-class bis-silane pretreatments — particularly amino-silane and bis-sulfur silane systems — approach Cr⁶⁺ chromate conversion coating performance on aluminum in moderate environments and pass most OEM qualification tests. In sustained aggressive conditions (continuous salt spray beyond 1000 hours, cyclic corrosion tests combining UV, humidity, and salt fog), current silane-only systems still show somewhat higher creep and earlier EIS degradation than optimized chromate references.
The gap closes meaningfully with hybrid systems: silane combined with zirconium hexafluoride or titanium alkoxide complexes in the pretreatment bath. These hybrid pretreatments benefit from both the covalent Si–O–metal bonding of the silane and the dense inorganic barrier formed by zirconia or titania in the film. In accelerated corrosion protocols used by several European automotive OEMs, these hybrid systems are now accepted as chromate equivalents for aluminum body panels — a significant qualification milestone that pure silane systems have not broadly achieved on steel in the same test regimes.
Frequently Asked Questions About Silane Coupling Agent Testing
These questions come up repeatedly in qualification discussions, incoming inspection disputes, and formulation troubleshooting. The answers below reflect what actually matters on the plant floor and in the lab.
What is the most important single test to specify when qualifying a new silane coupling agent for a glass-fiber composite application?
Interlaminar shear strength (ILSS) per ASTM D2344, run under both dry conditions and after 2-hour boiling water conditioning. No other single test packs as much diagnostic value into one protocol. The dry value tells you whether the silane is improving load transfer across the fiber-matrix interface at all. The boil-conditioned value tells you whether that improvement survives moisture — which is the failure mode that actually ends composite service life. A silane that improves dry ILSS by 40% but loses that gain entirely after boiling has formed a hydrolytically unstable interface and should be rejected regardless of its chemical characterization results. Expect well-optimized silane treatments on glass-epoxy systems to retain 70–90% of dry ILSS after conditioning, though exact retention depends on silane functional group chemistry, cure conditions, and fiber sizing compatibility.
How do I know if a silane is forming a true covalent bond or just physisorbing on the substrate?
XPS is the definitive answer. Chemisorbed silane shows a Si 2p binding energy near 102 eV, reflecting Si–O–substrate covalent linkages. Physisorbed material washes off with water, and the XPS spectrum shifts back toward the bare substrate signal. If your lab does not have XPS access, the practical proxy is adhesion retention after boiling water immersion: physisorbed films delaminate within minutes to an hour because they have no covalent anchor resisting hydrolytic undercutting. A chemisorbed silane layer holds because even partial Si–O–substrate bond density provides real mechanical resistance to moisture ingress.
Can accelerated weathering test results reliably predict outdoor service life?
Only if you have empirical correlation data for your specific product and geography. A commonly used approximation is that 1000 hours of QUV-A exposure per ASTM G154 corresponds to roughly 1–2 years of Florida outdoor exposure for silane-treated coatings — but that factor shifts significantly depending on UV stabilizer content, silane functional group stability, substrate reflectivity, and whether the service climate is humid subtropical or dry continental. Treat accelerated weathering as a screening and ranking tool, not a calendar. Always run parallel natural weathering panels when qualifying a new system for long-term outdoor use.
1000 hours QUV-A is universally equivalent to 1 year outdoor exposure for all silane-treated coatingsFalse
The QUV-to-outdoor correlation varies substantially with product formulation, UV stabilizer content, and geographic exposure conditions. The 1000 hours ≈ 1–2 years Florida estimate is a rough approximation used for preliminary screening, not a precise conversion factor applicable across all systems.
What silane concentration is optimal for surface treatment solutions, and how is it determined?
Optimal concentration is not a fixed number — it is substrate-specific and must be found by running a concentration optimization study that measures your target mechanical property across a range of silane loadings. For most aqueous-ethanol solutions applied to glass or metal, the optimum falls in the 0.5–2.0 wt% range. Below that, coverage is incomplete. Above it, excess silane condenses into poorly cross-linked multilayer deposits that are mechanically weak themselves and actually reduce adhesion performance. The dose-response curve typically shows a clear peak; qualifying a silane at an arbitrary concentration without this study risks operating on the wrong side of that peak.
How does SiliconChemicals validate silane coupling agent quality before shipment?
Standard release testing covers GC purity (≥97% or per grade specification), refractive index, specific gravity, appearance, and FTIR identity confirmation. For premium grades, the certificate of analysis also includes hydrolysis rate measurement, ²⁹Si-NMR condensation state to confirm the silane has not pre-oligomerized in storage, and a lap shear performance test on a reference glass-epoxy substrate run against an internal control standard. That last point matters: chemical purity alone does not guarantee interfacial performance, and the reference substrate test catches batch-to-batch functional variation that analytical methods alone can miss.
Are there standard test methods specifically designed for silane coupling agents as a product category?
No single universal silane standard exists. ISO 13985 covers some silane coupling agent product requirements, but performance qualification is necessarily application-specific. The most widely referenced methods are ASTM D2344 for composites, ASTM D4541 for pull-off adhesion in coatings, ASTM B117 salt-fog for corrosion protection on metal substrates, and ASTM D412/D2240 for rubber tensile and hardness properties. SiliconChemicals applies a multi-standard test battery matched to each product’s primary application rather than a single pass/fail screen.
What is the shelf life of silane coupling agents, and what tests confirm stability?
Most neat alkoxysilane coupling agents have a shelf life of 12–24 months when stored dry, sealed, and away from moisture and temperature extremes. Stability is confirmed by periodic GC purity retesting and viscosity measurement — rising viscosity is an early warning of oligomerization from moisture ingress. Pre-hydrolyzed aqueous solutions are a different situation entirely: pot life ranges from a few hours to a couple of days depending on silane type, pH, and solids content. Always check pH and visual turbidity before using a prepared hydrolysate; cloudiness indicates uncontrolled condensation and the solution should be discarded.
Selecting the Right Test Battery: A Practical Decision Framework for Engineers and Procurement Teams
Not every application needs the same depth of testing, and running a full qualification battery on a screening-stage candidate wastes budget and delays decisions. The practical discipline is knowing which tests to run at each stage, why, and what a failing result actually tells you about the interface chemistry.
Risk-Tiered Testing: Three Stages, Escalating Commitment
Stage 1 — Screening. At this stage you are eliminating candidates, not qualifying them. Run GC-MS to confirm purity and rule out hydrolyzed or oligomerized material that will behave inconsistently on the substrate. Pair that with a single mechanical performance test — lap shear per ASTM D1002 or interlaminar shear strength (ILSS) per ASTM D2344 depending on whether you are working with an adhesive bond or a composite — run both dry and after 24–48 hours immersion in 60–70 °C water. That wet/dry ratio is your first durability signal. If a candidate silane drops more than 40–50% in wet lap shear relative to dry, it will almost certainly fail any subsequent humidity aging protocol. Discard it now rather than after two months of development work.
Stage 2 — Development. Once you have one or two candidates surviving screening, add surface-analytical and application-specific tools. Contact angle measurement is low-cost and tells you whether the silane monolayer has actually rendered the surface reactive for your matrix resin. For glass fiber composites and metal primers, XPS adds the element-level confirmation of Si–O–substrate bond formation that contact angle alone cannot provide. For silica-filled rubber compounds, add Payne effect measurement per standard DMA protocols and a bound rubber extraction; these two together reveal whether the silane is genuinely coupling filler to polymer or just plasticizing the interface. For metal corrosion protection applications, electrochemical impedance spectroscopy (EIS) per ASTM G106 at this stage pays for itself — it catches interface degradation mechanisms 4–8 weeks before visual or salt-spray failure would show them.
Stage 3 — Qualification. This is the full battery: accelerated humidity aging per ASTM D2247 or ISO 6270, neutral salt spray per ASTM B117 (500–1000 hours depending on end-use environment), UV weathering per ASTM G154 or G155 at 500–2000 hours scaled to expected service life, and thermal cycling across the temperature range the application actually sees. Correlate at least one lot of qualification panels to natural weathering exposure if your application is exterior — accelerated tests compress time but compress it unevenly for different degradation mechanisms.
Application-to-Test Matrix
| Application | Primary Tests | Secondary / Qualification Tests | Key Standards |
|---|---|---|---|
| Glass fiber composites | ILSS dry + wet, GC-MS | XPS, SFG spectroscopy, flexural fatigue | ASTM D2344, D5229 |
| Silica rubber compounds | Payne effect, bound rubber | DMA tan δ, abrasion (DIN 53516) | ISO 4664-1, DIN 53516 |
| Metal corrosion protection | EIS, salt spray | XPS, filiform corrosion (ASTM D2803) | ASTM B117, G106 |
| Adhesive primers | Lap shear dry + wet, T-peel | Contact angle, thermal cycle adhesion | ASTM D1002, D1876 |
| Construction sealants | Pull-off adhesion, water immersion | Xenon arc weathering, elongation retention | ASTM C794, G155 |
| Electronic encapsulants | Adhesion after reflow, 85 °C/85% RH | EIS, TMA (CTE mismatch cycling) | IPC-TM-650, ASTM E831 |
Substrate Considerations That Drive Test Selection
Porous substrates — concrete, wood, mineral fiber — absorb silane solution into the bulk, making surface-analytical tools like XPS or ToF-SIMS difficult to interpret without careful sample preparation. Contact angle and pull-off adhesion after wet conditioning are more operationally meaningful here. Non-porous substrates — polished metal, dense glass — give clean XPS signals and reward the investment in surface spectroscopy. Reactive polymer matrices with functional groups that can co-react with the silane organofunctional end require functional-group-matching verification before mechanical testing; running ILSS on a vinyl-silane-treated fiber in an epoxy matrix will give you misleading numbers if the sizing cure chemistry was never confirmed.
Cost Versus Information Value
GC-MS and contact angle are your high-throughput, low-cost workhorses — combined reagent and instrument time cost typically in the range of tens of dollars per sample depending on laboratory overhead. XPS and ToF-SIMS carry instrument access costs one to two orders of magnitude higher and are justified only at qualification stage or when a field failure investigation demands interface-chemistry resolution. DMA and EIS sit in the middle: moderate cost, high information density for dynamic fatigue and corrosion applications respectively, and worth pulling forward to Stage 2 if your end application involves cyclic loading or aqueous environments.
How SiliconChemicals Supports Customer Testing Programs
SiliconChemicals provides reference test specimens — standard E-glass fiber rovings, polished steel Q-panels, and fumed silica compounds — treated with benchmark silane grades so customers can anchor their in-house results against a known baseline rather than starting in a void. Technical data sheets include performance data on model substrates across the Stage 1 test set, giving procurement teams a defensible comparison before committing to lab time. Application engineers are available for consultation on treatment process variables — concentration, pH, solvent system, substrate temperature — that strongly influence which test results you will get and why. For customers developing novel treatment processes or requiring silane molecules with modified organofunctional groups, co-development agreements allow iterative optimization against agreed test criteria, shortening the qualification cycle considerably.
SiliconChemicals provides reference test substrates and benchmark silane performance data to support customer qualification programsTrue
This is a stated capability of SiliconChemicals as described in the project persona and section brief; customers should confirm current service availability directly with the supplier
Where Silane Testing Is Heading
Sum frequency generation (SFG) vibrational spectroscopy is moving from research curiosity to practical tool — it can probe buried silane interfaces in situ under stress or in aqueous environments without destructive preparation, something no current standard test achieves. Machine learning correlation of accelerated aging data to field service life is a genuine near-term development; the challenge is building training datasets large enough to be meaningful, which requires industry-level data sharing that is only beginning. Digital twin models of silane-treated composite interfaces, incorporating molecular dynamics at the nanoscale with FEA at the part scale, are being demonstrated in academic-industrial partnerships. SiliconChemicals actively participates in research collaborations targeting these capabilities — because the next competitive edge in silane supply is not price alone, it is the ability to predict interface performance before a single panel goes into the aging chamber.