Most people optimizing a diet for bone density, connective tissue support, or skin collagen run straight into a wall: nutrition databases rarely list silicon content, food labels never mention it, and the few sources that do surface online contradict each other badly enough to be useless. That gap matters operationally — clinicians prescribing dietary silicon for osteoporosis prevention, formulators designing silicon-fortified functional foods, and procurement teams sourcing food-grade silicon additives all need accurate baseline data. Without it, dietary strategies get built on guesswork, fortification targets miss the mark, and bioavailability — which swings from under 5% to over 50% depending on the food matrix — gets ignored entirely.
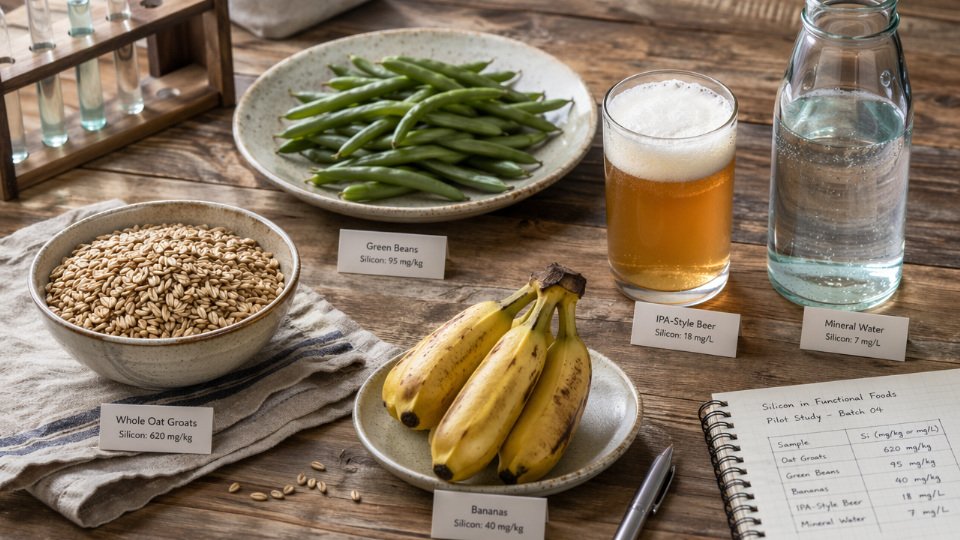
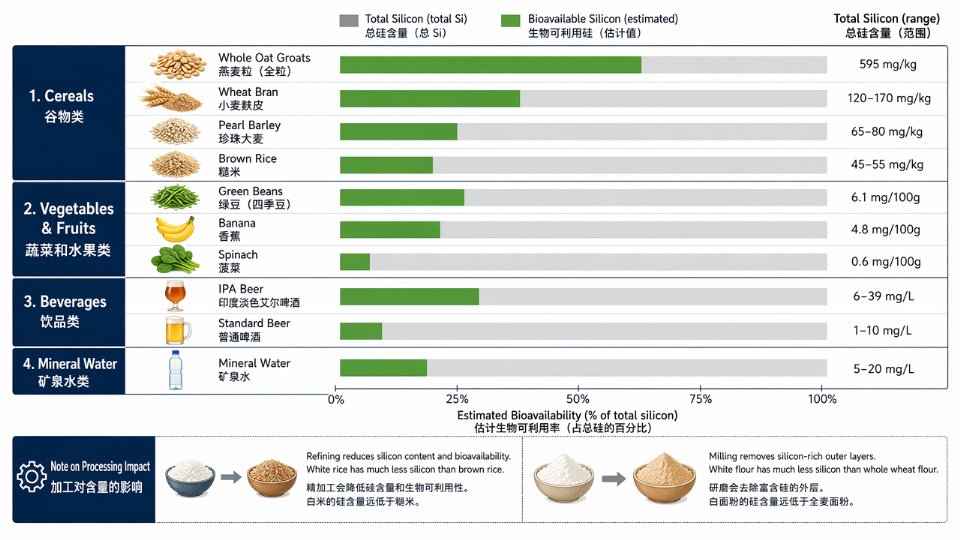
The highest dietary silicon sources are whole-grain cereals, certain vegetables, and beer. Whole oat groats reach approximately 595 mg Si/kg dry weight. Green beans deliver around 6.1 mg Si/100g fresh weight — the highest among common vegetables — and bananas provide roughly 4.8 mg Si/100g. Beer, particularly IPA-style, ranges from 6–39 mg Si/L with around 50% bioavailability as orthosilicic acid.
What makes silicon nutrition genuinely complex — and what most dietary guides skip — is that total content and bioavailable content are almost unrelated numbers. Phytolithic silica locked inside cereal cell walls clears the gut largely unabsorbed, while the soluble orthosilicic acid (OSA) in beer crosses the intestinal barrier at roughly ten times the rate. Processing destroys silicon systematically: white flour retains only about 15% of whole-wheat silicon after milling; white rice holds just 5–10% of brown rice silicon. Understanding which foods deliver silicon your body can actually use — and how industrial food-grade silicon compounds fit into this picture — requires looking at chemistry, processing, and physiology together.
Silicon in Food Science: Differentiating Elemental Si, Orthosilicic Acid, Phytolithic [Silica](https://siliconchemicals.com/silica/), and Food-Grade SiO2
One of the most persistent errors in consumer nutrition writing is treating “silicon” as a single entity — implying that the silicon in a rice husk, a glass of mineral water, a spice blend, and a dietary supplement capsule are the same thing delivering the same biological outcome. They are not. The chemical form determines bioavailability, regulatory treatment, and relevance to product formulation, and conflating them leads to misleading label claims, poorly designed fortification strategies, and misread clinical data.
Elemental Silicon: What It Isn’t
Start with the baseline correction: elemental silicon (Si, atomic number 14) does not exist as a free element in food. In nature, silicon is geochemically one of the most reactive elements toward oxygen — it exists almost exclusively as silicate minerals or amorphous silicon dioxide in biological systems. Any content referencing “silicon” in food actually means one of its oxidized or hydrated derivatives. This distinction matters not just editorially but analytically: ICP-OES measurement at 251.6 nm quantifies total dissolved silicon in a digested food matrix, and that result is reported as elemental Si equivalent — which is why food databases list values in “mg Si” even though what’s present is structurally silicic acid, phytolithic silica, or bound silicate. Readers who don’t understand that convention routinely misinterpret the figures.
Orthosilicic Acid (OSA): The Bioavailable Form
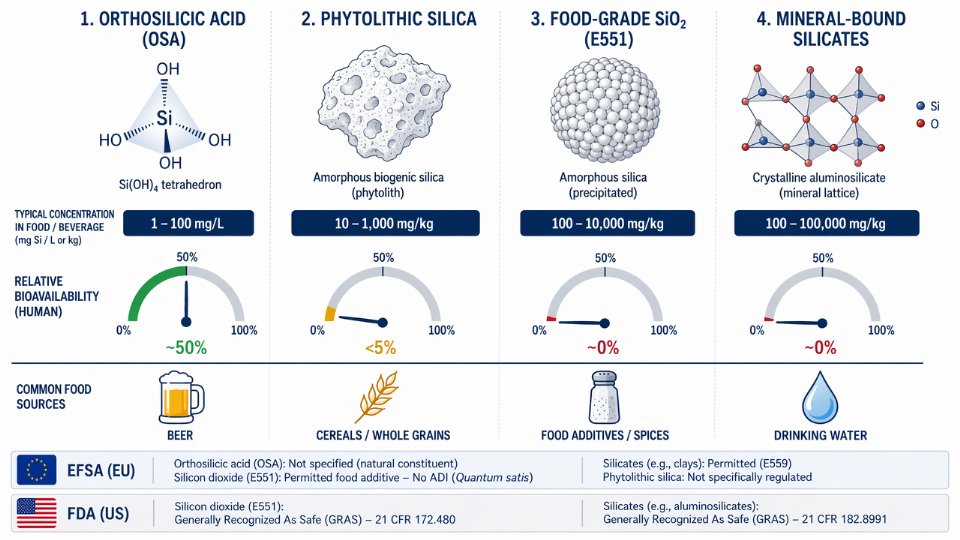
Orthosilicic acid [Si(OH)₄], molecular weight 96.11 g/mol, is the monomeric, water-soluble form of silicon and the primary species absorbed across the GI epithelium. In solution at concentrations below roughly 2 mM and pH below 7–8, OSA remains stable as a monomer; above those thresholds it begins polymerizing into oligomeric silicic acids, which are substantially less bioavailable. This polymerization behavior is why formulating a silicon-fortified beverage is not straightforward — push the concentration high enough to make a meaningful nutrient claim and you risk precipitation or reduced bioavailability before the product reaches the consumer.
OSA is present in beer at concentrations typically in the range of 6–39 mg Si/L, with IPA-style beers at the upper bound due to prolonged contact with high-silicon hops. Bioavailability from beer is approximately 50%, making it — somewhat inconveniently for public health messaging — one of the most efficiently absorbed dietary silicon sources available. Certain mineral waters, depending on geology, contribute OSA at 5–20% bioavailability; green vegetables like French beans deliver OSA in solution within their cellular fluid.
Phytolithic Silica: Structural, Not Nutritional
Phytolithic silica is amorphous SiO₂ deposited in plant cell walls and intercellular spaces as a structural element — think rice husks, wheat bran, bamboo shoots, and horsetail herb. Under electron microscopy, phytoliths appear as discrete glassy bodies within plant tissue. Because they are poorly soluble under GI conditions, absorption is estimated at less than 5% — an order of magnitude below OSA from beer.
This matters practically for anyone interpreting cereal silicon content data. Whole oat groats, at approximately 595 mg Si/kg dry weight, look impressive on paper. But the majority of that silicon is locked in phytolithic structures that pass largely intact through the digestive tract. The nutritional contribution per serving is real but far smaller than the raw concentration implies. In a typical product development scenario, a formulator who selects a high-bran flour ingredient purely on the basis of its total silicon content — without distinguishing OSA fraction from phytolithic SiO₂ — will design a product that underdelivers on any silicon bioactivity claim.
Beer is among the highest-bioavailability dietary silicon sources due to its orthosilicic acid contentTrue
OSA in beer is present at up to 39 mg/L in hop-heavy styles and is absorbed at approximately 50% efficiency — higher than phytolithic silica from cereals (<5%) or silicon from most mineral waters (5–20%).
Food-Grade Silicon Dioxide (E551): An Industrial Additive, Not a Nutrient Source
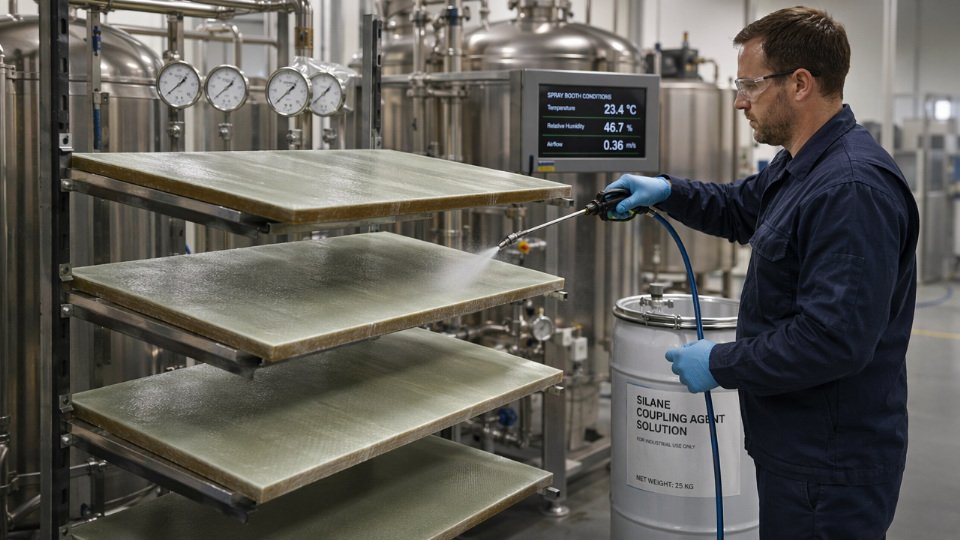
Food-grade SiO₂ — listed as E551 in the EU, generally recognized as GRAS under FDA review — is a synthetic anti-caking agent manufactured by high-temperature flame hydrolysis (fumed grade) or wet precipitation. Its function is physical: the high BET surface area (150–300 m²/g for fumed grades) creates a barrier between powder particles, preventing clumping in spice blends, powdered supplements, and instant beverages. Use levels commonly run 0.5–2%, with a regulatory maximum of 10,000 mg/kg (1%) under EU Regulation 1333/2008 for most food categories.
E551 is not a bioavailable silicon source. Its systemic absorption is near zero under normal GI conditions — the particles pass through without meaningful dissolution. This is not a failure of the ingredient; it is simply not its purpose. The EFSA safety re-evaluation initiated in 2018 focuses specifically on the nanoparticle fraction present in some fumed silica grades, not on toxicity from silicon absorption, because absorption isn’t occurring at any rate of concern.
Food-grade SiO2 (E551) contributes meaningfully to dietary silicon bioavailabilityFalse
E551 functions as a physical anti-caking agent with near-zero systemic absorption under GI conditions. Its particle size and low solubility at physiological pH prevent meaningful OSA release, making its nutritional silicon contribution effectively negligible.
Bioavailability Comparison Across Forms
| Silicon Form | Typical Food Source | Concentration Range | Estimated Bioavailability |
|---|---|---|---|
| Orthosilicic acid (OSA) | Beer, mineral water, green vegetables | 0.1–39 mg/L or mg/100g | ~50% (beer); 5–20% (mineral water) |
| Phytolithic silica (amorphous SiO₂) | Rice husks, wheat bran, bamboo shoots, horsetail | Up to 595 mg Si/kg dry weight (cereals) | <5% |
| Food-grade SiO₂ (E551, fumed/precipitated) | Powdered foods, spice blends, supplement capsules | 0.5–2% w/w in finished product | ~0% systemic |
| Mineral-bound silicates | Clay-contaminated water, certain root vegetables | Highly variable; trace to low mg/kg | Negligible (insoluble forms) |
Quick verdict: When evaluating any food or ingredient for silicon bioactivity, always ask which form is present — total silicon content without speciation is, at best, an incomplete data point and, at worst, actively misleading.
The practical consequence of ignoring these distinctions runs in both directions. A supplement brand that markets a rice-bran extract as a “high-silicon” product without disclosing that the silicon is predominantly phytolithic is making an implicitly misleading efficacy claim. Conversely, a formulation team that dismisses a mineral water base as a minor silicon contributor — because the total concentration looks low — may be discarding the highest-bioavailability silicon source in their entire ingredient deck.
Ranked Food Sources by Silicon Content: Cereals, Vegetables, Beverages, and Mineral Water — With Actual mg/100g Data
Silicon is not evenly distributed across the food supply. It concentrates predictably in plant tissues that build structural rigidity — grain husks, legume pods, grass stems — and arrives at the table in forms ranging from highly bioavailable orthosilicic acid (OSA) in beer and mineral water to largely inert phytolithic silica locked inside cereal cell walls. Understanding those concentrations, and what processing does to them, is the foundation for any serious discussion of dietary silicon, whether you are a nutritionist calculating intake adequacy or a food technologist evaluating fortification options.
Cereal Grains: The Dominant Dietary Category
Whole cereal grains represent by far the highest natural silicon concentrations in any commonly consumed food group, and the mechanism is structural rather than metabolic. Silicon is deposited as amorphous silica (SiO₂·nH₂O) and silicified cell wall polymers in the outer bran and husk fractions during grain development — essentially functioning as a biological armor. Whole oat groats reach approximately 595 mg Si/kg dry weight, making them the standout cereal source. Wheat bran runs 120–170 mg/kg, pearl barley 65–80 mg/kg, and brown rice 45–55 mg/kg.
The critical operational consequence is what milling and polishing do to those numbers. White rice retains only 5–10% of brown rice silicon after the bran and germ are removed. Refined white flour retains roughly 15% of whole-wheat silicon content. From a food composition standpoint, a bowl of instant white rice and a bowl of cooked oat groats are not in the same ballpark — they differ by an order of magnitude in silicon delivery.
In a typical large-scale commercial bakery transitioning product lines toward refined white flour to improve shelf texture, the silicon contribution from the grain fraction drops so sharply that it effectively exits the nutritional equation. This is rarely flagged in reformulation audits because silicon is not yet a regulated labeling nutrient in most jurisdictions, but for manufacturers building functional or “bone health” positioning, the milling fraction choice is a real and quantifiable variable.
Vegetables and Fruits: Selective Concentrators
Among vegetables, green beans (French beans) are the clear outlier at approximately 6.1 mg Si/100g fresh weight — roughly ten times the silicon content of spinach (around 0.6 mg/100g) and well above typical leafy brassicas, which range 0.5–1.5 mg/100g. Root vegetables like carrots and parsnips sit in the 1.5–3.5 mg/100g range, reflecting moderate silicification in structural tissue. The silicon in vegetables is present primarily as OSA dissolved in cell fluid and as loosely bound silica in fibrous cell walls — not as dense phytoliths — which makes bioavailability modestly higher than cereal fractions, though still lower than beer-derived OSA.
Fruit silicon is generally low, with banana as a notable outlier at approximately 4.8 mg/100g. Dried fruits — figs and dates particularly — reach 2–4 mg/100g because water removal concentrates whatever silicon was present in the fresh tissue. Strawberries are unremarkable at around 0.8 mg/100g. The banana figure surprises most practitioners because fruit is rarely considered a meaningful silicon source; the chemistry reflects silicon involvement in the structural integrity of the peel and the starchy pulp matrix.
Whole oat groats are one of the highest natural food sources of siliconTrue
Peer-reviewed food composition analyses consistently place whole oat groats at approximately 595 mg Si/kg dry weight, driven by dense amorphous silica deposition in the oat husk and bran fraction — the highest measured value among commonly consumed cereal grains.
Beverages: High Bioavailability Offsets Modest Concentrations
Beer delivers silicon in a form that changes the bioavailability calculation entirely. At 6–39 mg Si/L — with IPA-style beers at the upper range due to elevated hop content — beer is the single highest-bioavailability silicon source in a typical Western diet. OSA from beer is absorbed at approximately 50%, compared to 5–20% from mineral water and under 5% from cereal phytolithic silica. A half-liter of a high-hop IPA therefore delivers roughly 10–20 mg of effectively absorbable silicon — comparable to an entire day’s intake from a refined-grain diet.
Commercial mineral waters span 1–35 mg Si/L depending entirely on the geological formation the water passes through. Waters sourced from silica-rich volcanic or granitic aquifers consistently reach the upper range; soft lowland waters are near the floor. Tap water averages 0.5–10 mg/L across municipal supplies. Brewed coffee contributes 3–7 mg Si/L as OSA extracted from the roasted bean matrix during brewing — a meaningful but often overlooked daily source for high-consumption populations.
Animal Products: A Near-Zero Contribution
Beef, poultry, and dairy all fall below 0.5 mg Si/100g. Silicon does not concentrate in animal tissue; it is not incorporated into mammalian structural proteins the way it is in plant cell walls. This is why omnivorous dietary patterns with low whole-grain and legume intake routinely show silicon intake in the lower portion of the Western range (14–21 mg/day) and why populations whose dietary transition has shifted away from whole cereals toward refined grains and animal protein show the most pronounced reduction in silicon biomarkers.
Quick verdict: If a diet audit shows heavy reliance on refined grains, white rice, and animal protein with minimal legumes or unprocessed cereals, dietary silicon intake is almost certainly in the low single digits of milligrams per day — a fraction of intakes associated with favorable bone density outcomes in the Framingham data.
Ranked Silicon Content Reference Table
| Food Item | Category | Silicon Content | Silicon Form Present | Processing Impact Notes |
|---|---|---|---|---|
| Whole oat groats | Cereal grain | ~595 mg/kg DW (~59.5 mg/100g DW) | Phytolithic SiO₂, cell wall silica | Rolled/instant oats lose significant husk fraction |
| Wheat bran | Cereal fraction | 120–170 mg/kg DW | Phytolithic silica, bound silica esters | Removed entirely in white flour milling |
| Pearl barley | Cereal grain | 65–80 mg/kg DW | Cell wall amorphous silica | Pearling reduces by 40–60% |
| Brown rice | Cereal grain | 45–55 mg/kg DW | Husk/bran silica | White rice retains only 5–10% |
| Green beans (French beans) | Vegetable | ~6.1 mg/100g FW | Dissolved OSA, loosely bound silica | Minimal loss; boiling leaches some OSA |
| Banana | Fruit | ~4.8 mg/100g FW | Structural silica, dissolved OSA | Ripe vs. unripe shows minor variation |
| Beer (IPA-style) | Beverage | 19–39 mg/L | Dissolved OSA (~50% bioavailable) | Hop content drives upper range |
| Beer (lager/ale, typical) | Beverage | 6–18 mg/L | Dissolved OSA | Malt silicon dominant in lager |
| Dried figs / dates | Fruit (dried) | 2–4 mg/100g | Concentrated dissolved and bound silica | Dehydration concentrates all minerals |
| Mineral water (siliceous source) | Beverage | 10–35 mg/L | Dissolved OSA (5–20% bioavailable) | Source geology is determinative |
| Root vegetables (carrot, parsnip) | Vegetable | 1.5–3.5 mg/100g FW | Loosely bound silica, some OSA | Peeling reduces content marginally |
| Brewed coffee | Beverage | 3–7 mg/L | Dissolved OSA extracted during brewing | Espresso vs. filter shows minor difference |
| Leafy brassicas (cabbage, kale) | Vegetable | 0.5–1.5 mg/100g FW | Cell wall silica, dissolved OSA | Minimal processing effect |
| Spinach | Vegetable | ~0.6 mg/100g FW | Loosely bound and dissolved forms | Boiling leaches into cooking water |
| Mineral water (soft/lowland) | Beverage | 1–5 mg/L | Dissolved OSA | Low silica geology, often below detection |
| Tap water (typical municipal) | Beverage | 0.5–10 mg/L | Dissolved OSA | Wide regional variance |
| Strawberries | Fruit | ~0.8 mg/100g FW | Dissolved OSA, trace structural silica | Negligible processing effect |
| White rice (polished) | Cereal grain | ~2–5 mg/kg DW | Residual grain-body silica | 90–95% of brown rice silicon removed |
| Refined white flour | Cereal fraction | ~18–25 mg/kg DW | Residual starchy endosperm silica | ~15% of whole-wheat silicon retained |
| Beef / poultry / dairy | Animal protein | 40 mg/day) versus the lowest quartile (<14 mg/day), consistent with OSA’s role as a prolyl hydroxylase cofactor in collagen synthesis.”] |
What the Spector Clinical Trial Added
The double-blind, 12-week study by Spector et al. (2008) specifically tested choline-stabilised OSA (ch-OSA) supplementation against collagen biomarkers in women with photodamaged skin. It confirmed measurable increases in skin collagen density and bone collagen biomarkers at supplemented doses — a result that is industrially relevant for nutraceutical and cosmetic formulators sourcing bioavailable silicon inputs, because it establishes a minimum effective concentration and delivery vehicle requirement. Bioavailability from the ch-OSA form is substantially higher than from phytolithic silica; formulators who substitute a cheaper cereal-derived silicon ingredient without correcting for the bioavailability gap — phytolithic silica absorbs at under 5% versus roughly 50% for OSA — will not replicate the clinical outcome even if the label silicon content appears equivalent.
Intake Targets, Gender Differences, and the Absence of a Formal RDA
No formal RDA for silicon has been established by EFSA or FDA. European expert panels have suggested 20–50 mg/day as a reasonable target for connective tissue support, and the practical gap from real-world intake is narrower for men than women. Median Western dietary silicon intake is commonly estimated in the range of 20–30 mg/day for men and 15–25 mg/day for women — the difference driven largely by lower consumption of beer and whole-grain cereals among women on typical Western diet patterns. Traditional Asian diets, heavy in rice-based products and vegetable side dishes, tend toward 40–60 mg/day, which may partially explain population-level BMD differences that are difficult to attribute to calcium intake alone.
In a typical clinical nutrition trial evaluating a silicon-fortified beverage, this intake gap becomes operationally critical. If the baseline population already sits at 20–25 mg/day and the fortification adds another 10–15 mg/day as a well-absorbed OSA form, the trial should be powered to detect a modest incremental BMD effect — not the large effect size one might infer from comparing extreme population quartiles. Misreading the epidemiological data as a dose-response curve that extends linearly from zero is one of the more common formulation planning errors.
Urinary Silicon as a Clinical Biomarker
Because OSA absorbed from food and supplements is not stored in soft tissue to any significant degree, it is excreted renally, and urinary silicon concentration provides a reliable integrated biomarker of dietary silicon intake. Healthy adults with normal renal function typically show urinary silicon concentrations in the range of 10–30 mg/L; values below this range in a clinical study population suggest either low dietary intake or a delivery form with poor bioavailability. For product developers and clinical trial designers, urinary silicon monitoring is considerably more practical than bone turnover markers over short trial windows — it confirms whether the ingredient is being absorbed at all before committing to a 12-month BMD endpoint.
Quick verdict: When evaluating silicon ingredients for nutraceutical or clinical nutrition applications, bioavailability form — not total silicon content on the certificate of analysis — determines whether a connective tissue health claim can be supported by the underlying mechanism.
Industrial Intersection: Where Food-Grade Silicon Demand Meets Organosilicon Supply Chain — Anti-Caking, Encapsulation, and Food-Contact Silicones
The same silicon chemistry that underpins semiconductor wafer polishing and automotive sealants runs quietly through every commercial kitchen, fermentation tank, and functional food production line in the world. Understanding where dietary silicon originates is only half the picture — the other half is the industrial organosilicon supply chain that puts silicon into food systems by design, as processing aids, contact materials, and encapsulation matrices.
Food-Grade Silicon Dioxide (E551): Fumed Silica as a Functional Powder Additive
Food-grade silicon dioxide is produced by two established vapor-phase routes: flame pyrolysis of silicon tetrachloride (SiCl₄) — the fumed silica pathway — or wet-process precipitation. The fumed route yields a product with BET surface areas commonly in the range of 150–300 m²/g, which is precisely what drives its anti-caking performance in powdered foods. At inclusion rates of 0.5–2% by weight, fumed silica disrupts particle-to-particle adhesion in spice blends, powdered creamers, protein powders, and pharmaceutical excipients by physically spacing out hydrophilic surfaces and reducing moisture-bridging. Under EU Regulation 1333/2008, E551 carries a maximum use level of 10,000 mg/kg (1% w/w) across most food categories. Global demand for food-grade SiO₂ runs at roughly 85,000 MT/year — a figure that makes it one of the largest-volume food additive applications of silicon chemistry worldwide.
The consequence of sourcing outside food-grade specification is not always immediate. A powder blend reformulated with industrial-grade fumed silica — lower purity, inconsistent surface chemistry, potential heavy-metal contamination — may flow acceptably for months before audit findings or trace-metal exceedances trigger a recall investigation. The source of the failure is rarely traced back to the silica supplier quickly, because no process alarm fires on day one. It surfaces as a drift in QA results.
All silicon dioxide used in food is chemically identical regardless of production routeFalse
Fumed silica (vapor-phase) and precipitated silica have fundamentally different surface area, porosity, and particle morphology. Fumed grades (150–300 m²/g BET) are preferred for anti-caking in dry powders; precipitated grades are used in different food and feed applications. The production route determines functional performance and regulatory classification, not just purity.
Silicone Defoamers (PDMS, E900): The Fermentation and Refining Connection
Polydimethylsiloxane emulsions — food-grade PDMS — serve as the defoamer of choice across cooking oil refining, sugar processing, vinegar production, and alcoholic fermentation, at use levels of 1–10 ppm. The regulatory framework is precise: FDA 21 CFR 173.340 governs PDMS as a defoaming agent in food, and EU Regulation 1333/2008 lists it as E900. The connection to dietary silicon is operationally direct — the beer and wine industries, which produce the beverages carrying the highest bioavailable OSA loads (6–39 mg Si/L in beer), routinely use PDMS defoamers during fermentation and tank transfers. The PDMS itself does not contribute meaningfully to the silicon content of the final beverage at permitted concentrations, but the fermentation chemistry it stabilizes is what allows high-silicon hop extracts and grain wort to retain their silica content through to the finished product.
In a typical large-scale sugar refinery running continuous evaporation, foam events during concentration can interrupt vacuum, reduce throughput by 15–30% during an upset, and force operators to manually intervene with higher defoamer doses — temporarily becoming the permanent setpoint. Maintaining PDMS emulsion stability and correct dosing discipline requires that the base polymer meets consistent viscosity and chain-length specifications, which is where upstream siloxane quality directly affects downstream process economics.
Quick verdict: For food-grade PDMS supply, viscosity consistency lot-to-lot matters more than headline purity — a drift in molecular weight distribution changes emulsion droplet size and defoamer response time before any obvious specification limit is breached.
Food-Contact Silicone Materials: HCR, LSR, and the Polymer Base Material Chain
High-consistency rubber (HCR) and liquid silicone rubber (LSR) have displaced many thermoplastics and elastomers in direct food-contact applications — baking molds, gaskets, peristaltic pump tubing, conveyor belt surfaces, and infant feeding products. The regulatory compliance chain is layered: FDA 21 CFR 177.2600 covers rubber articles intended for repeated food contact in the US; EU Regulation 10/2011 governs plastic and silicone food-contact materials in Europe, requiring migration testing at 40°C over 10 days across simulants A through D; China’s GB 4806.11-2016 sets the equivalent national standard. Converters manufacturing finished silicone food-contact parts source polydimethylsiloxane gum or silicone polymer base from upstream producers — SiliconChemicals’ silicone polymer lines serve precisely this tier of the value chain.
The compliance risk at the converter level often originates upstream: a base silicone polymer that carries residual catalyst metals above specification, or inconsistent crosslinker ratios, can cause finished articles to fail migration tests even when the converter’s molding process is correctly controlled. Traceability from polymer batch to finished article is the audit requirement that separates a reliable upstream supplier from a price-only option.
Silica Encapsulation Matrices: From Sol-Gel Chemistry to Functional Food Formats
Sol-gel silica encapsulation — using tetraethyl orthosilicate (TEOS) or colloidal silica as the matrix precursor — is an active area in functional food ingredient delivery. Omega-3 oils, probiotics, and heat-sensitive vitamins encapsulated within porous silica shells show significantly improved oxidative stability and controlled-release profiles compared to lipid-only encapsulation systems. The purity demands on the silicon raw material at this application tier are among the strictest in food technology: trace metals, particularly iron and aluminum, must be controlled at sub-ppm levels to avoid catalytic oxidation of sensitive lipid payloads.
The same supply chain geometry that feeds semiconductor-grade silica precursors also feeds the nutraceutical sector developing choline-stabilized orthosilicic acid (ch-OSA) supplements — ultra-pure silicon chemistry inputs with ISO 22000, HACCP, and Halal/Kosher certification layers added on top of chemical purity specifications.
Food-Industrial Silicon Applications at a Glance
| Food-Industrial Application | Silicon/Silicone Product Used | Applicable Regulatory Standard | Purity/Grade Requirement |
|---|---|---|---|
| Anti-caking in powdered foods (E551) | Fumed or precipitated SiO₂ | EU 1333/2008; FDA 21 CFR 172.480 | BET 150–300 m²/g; heavy metals per food additive monograph; Cpk ≥1.33 on key QC parameters |
| Defoamer in fermentation/refining (E900) | Food-grade PDMS emulsion | FDA 21 CFR 173.340; EU 1333/2008 (E900) | Max 10 ppm in food; consistent viscosity grade; low-volatiles specification |
| Food-contact molded parts (HCR/LSR) | Silicone polymer base (PDMS gum/fluid) | FDA 21 CFR 177.2600; EU 10/2011; GB 4806.11-2016 | Migration limits met in simulants A–D; catalyst residuals controlled; full batch traceability |
| Encapsulation matrix for functional ingredients | TEOS or colloidal silica (sol-gel precursor) | Novel food/ingredient-specific frameworks; ISO 22000 supply chain | Sub-ppm trace metals; particle size distribution controlled; food-grade certification documentation |
Chinese integrated organosilicon producers operating across the full siloxane value chain — from SiCl₄ hydrolysis through polymer and downstream specialty product — carry a structural cost advantage of 15–25% per MT versus Western equivalents for comparable-grade PDMS and fumed silica precursors, while increasingly meeting the ISO 22000 and third-party audit requirements that food-industrial converters and nutraceutical formulators demand. The supply chain convergence point is real: the molecule that the Framingham cohort was consuming in whole grains is chemically kin to the molecule being specified in a food-grade defoamer purchase order.
Processing, Cooking, and Storage Effects on Silicon Retention: What Food Technologists Need to Know Before Formulating
Silicon content in a food matrix is not fixed at harvest. Every thermal, mechanical, and aqueous processing step either concentrates, degrades, leaches, or chemically transforms the silicon fraction — and the form it ends up in determines whether it is bioavailable or biologically inert. Food technologists who design silicon-functional products without accounting for these transformations will consistently overshoot or undershoot their target serving dose, then struggle to explain why urinary silicon biomarkers in clinical validation don’t match the label claim.
Milling and Refining: The Single Largest Silicon Loss in the Global Diet
The bran and aleurone layers of cereal grains are where phytolithic silica concentrates — typically 120–170 mg Si/kg in the bran fraction of wheat. When whole wheat is milled to white flour, those outer layers are mechanically separated, and white flour retains only 15–25 mg Si/kg, representing a 70–85% silicon depletion in a single processing step. On a population scale, this is the dominant driver of the gap between traditional high-grain diets (estimated 40–60 mg Si/day) and Western refined-grain diets (14–21 mg/day).
The practical formulation consequence: you cannot recover this loss by adjusting cooking method. Once the bran is separated, the silicon leaves the product stream. Whole-grain inclusion rates, wheat bran fortification, or synthetic OSA addition are the only realistic corrective levers.
Quick verdict: If your product is built on white flour or refined starch, assume the cereal silicon contribution is negligible — any functional silicon claim requires either a whole-grain base or active fortification.
Aqueous Cooking: Leaching Losses Depend Entirely on Water Ratio
Orthosilicic acid is water-soluble, which means boiling transfers a measurable fraction of silicon from vegetable tissue into the cooking water. For green beans — the highest-silicon common vegetable at roughly 6 mg Si/100g fresh weight — boiling in a large excess of water for 8–10 minutes loses an estimated 25–40% of silicon to the water phase. Steaming over, not in, water cuts those losses significantly; the silicon that would have diffused into bulk water has nowhere to go.
In a typical institutional catering or food-manufacturing operation producing blanched vegetables for frozen ready-meals, boil-and-discard water protocols are standard for texture control. The silicon loss is invisible — it generates no reject, no alarm, no yield variance flag — but it quietly degrades the nutritional profile of every batch. Retaining blanch water and reincorporating it into sauces or broths is technically feasible, though rarely practiced unless nutrition labeling creates a commercial incentive to do so.
Fermentation: The Bioavailability Amplifier
Fermentation is the one processing operation that improves silicon’s functional value rather than diminishing it. During brewing, endogenous and added enzymes break down the silica-rich cell walls of barley malt and hops, solubilizing phytolithic silica into orthosilicic acid across the mash and fermentation stages. The result is a beverage delivering 6–39 mg Si/L in a form with approximately 50% bioavailability — compared to less than 5% for the raw grain matrix.
Fermentation pH, temperature, enzyme charge, and contact time all influence OSA yield. Mash pH held in the 5.2–5.6 range typical for brewing supports silica solubilization; higher pH accelerates OSA polymerization back toward colloidal silica, reducing bioavailability. This same chemistry is directly relevant to any fermented food or functional beverage developer considering silicon bioavailability as a formulation target.
All populations need the same silicon supplementation dose to achieve bone health benefitsFalse
Supplementation relevance is baseline-dependent. A 5 mg Si/serving addition is proportionally significant for a North American consumer at 14–21 mg/day but marginal for a traditional Asian diet consumer already at 40–60 mg/day. Dosing strategy must account for regional dietary baselines.
Mineral Water Geography: Volcanic and Granite Geology as a Hidden Intake Variable
Naturally silicon-rich mineral waters cluster around volcanic and granite geological formations — Iceland, the Scottish Highlands, parts of Japan, and certain regions of France among the most documented. Spring waters from these geological zones can contain 20–35 mg Si/L, predominantly as orthosilicic acid (OSA), which is the most bioavailable form with absorption rates commonly in the 5–20% range depending on concentration and gut pH. For a consumer drinking one liter of high-silicon mineral water daily, that single source may contribute 20–35 mg Si — matching or exceeding the entire daily food-derived intake of a typical North American.
This is not uniform across “mineral water” as a category. Many widely sold mineral waters contain less than 5 mg Si/L, and the silicon content is rarely prominent on consumer labeling despite being a regulated reportable parameter in several jurisdictions. Food product developers incorporating mineral water as a formulation ingredient — in functional beverages, sports drinks, or RTD nutritional products — should obtain silicon content specifications from their water supplier rather than assuming category-level homogeneity.
Beer Consumption as a Regional Silicon Source
Countries with high per-capita beer consumption show measurably higher population-level silicon intakes from this single source. A standard liter of typical Central European lager delivers roughly 6–20 mg Si; an IPA-style beer reaches 20–39 mg Si/L due to the elevated hop content — hops being one of the highest-silicon botanical ingredients in common use. In Czech Republic, Germany, and Belgium, regular moderate beer consumption can contribute 10–25 mg Si/day to total intake for individual consumers, an increment that rivals whole-grain cereal contributions and exceeds most vegetable sources by volume.
The OSA bioavailability from beer is approximately 50% — significantly higher than the sub-5% typically achieved from phytolithic silica in cereals — which means beer’s silicon contribution to absorbable intake is disproportionate to its raw concentration. This is a chemically important distinction that population dietary surveys using raw food-composition totals tend to undercount.
Supplementation Thresholds Vary by Market: A Decision Table for Product Developers
| Dietary Pattern / Region | Estimated Daily Silicon Intake (mg/day) | Primary Silicon Food Sources | Supplementation Relevance |
|---|---|---|---|
| Traditional Asian (Japan, Korea, rural China) | 40–60 | Brown rice, millet, bamboo shoots, sorghum, tofu | Low — baseline already at or above levels associated with BMD benefit in epidemiological data; high-dose supplementation offers limited headroom |
| Mediterranean (Southern Europe, MENA whole-grain variants) | 30–45 | Whole-grain bread, legumes, vegetables, mineral water | Moderate — targeted fortification (e.g., bone-health claims) may add value; dose must exceed background noise |
| Western European (mixed, with beer culture) | 20–35 | Whole-grain cereals, beer, mineral water | Moderate — beer and mineral water create high individual variability; survey-level averages mask wide ranges |
| North American (refined grain, high UPF) | 14–21 | Refined cereals, vegetables (diminished), mineral water if consumed | High — meaningful supplementation gap; even modest additions (5–10 mg/serving) produce proportionally significant intake shifts |
| Ultra-processed diet dominated (<10 mg/day) | Procurement and formulation note: Food manufacturers developing silicon-functional products for global distribution cannot apply a single dosing strategy across markets. The same label claim — “supports bone health” with a 5 mg Si serving — may meet or miss clinically relevant thresholds depending entirely on what the target consumer eats for the rest of the day. Regional dietary intake data should be an input to formulation specification, not an afterthought in marketing. |
Procurement and QC Audit Framework: Specifying Silicon Content in Food Ingredients and Industrial Silicon Raw Materials
Silicon procurement failures rarely announce themselves at goods receipt. They surface three weeks later when a powder blend clumps on the filling line, when a regulatory audit flags a migration exceedance in a food-contact silicone gasket, or when a batch-to-batch surface area drift quietly erodes anti-caking performance until operators compensate by increasing dose — and nobody connects the rising additive spend to an off-spec incoming material. Building a rigorous specification and audit framework before the purchase order is signed is the only reliable way to avoid that sequence.
Analytical Methods: Choosing the Right Silicon Measurement Tool for the Matrix
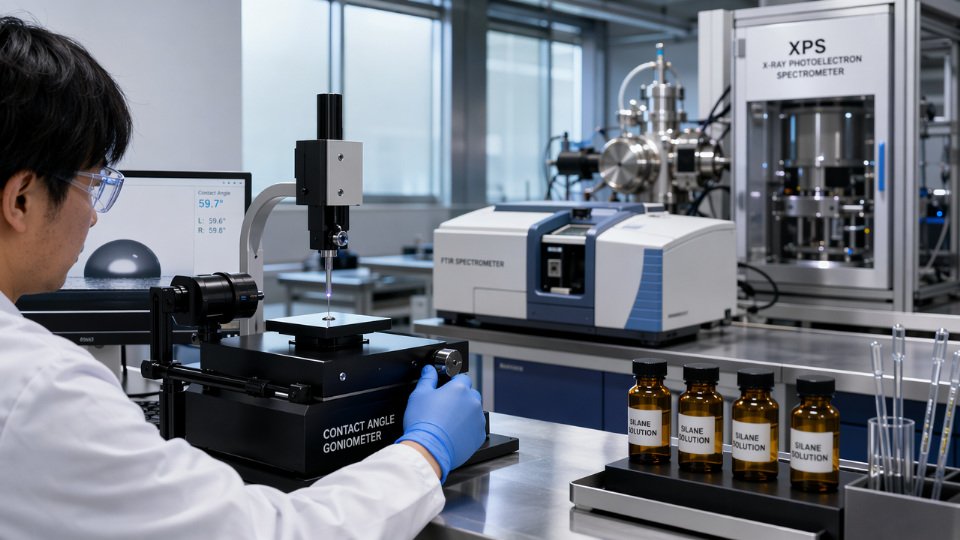
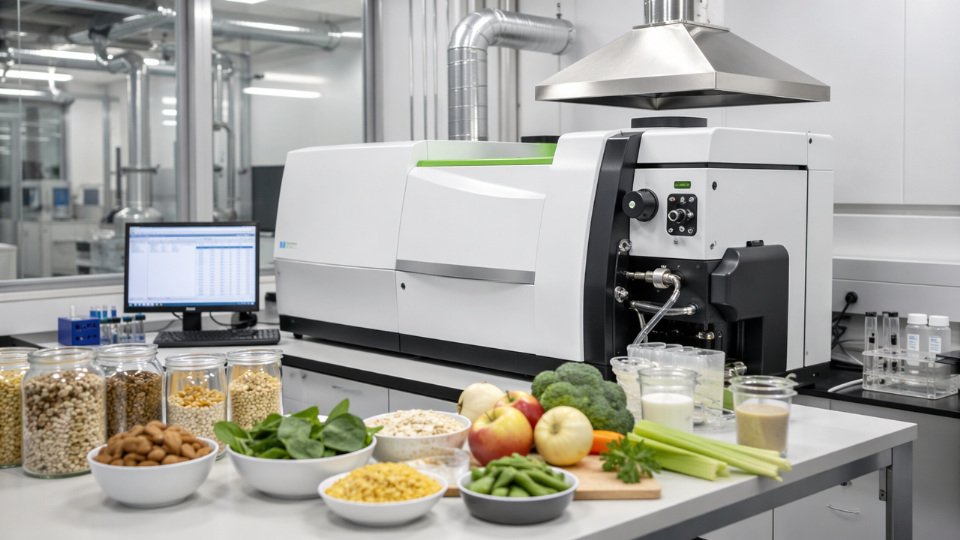
ICP-OES at the 251.6 nm emission wavelength is the industry gold standard for total silicon quantification across food matrices, raw ingredients, and finished silicon chemical products. Detection limits reach approximately 0.01 mg/kg in prepared solution, which is more than sufficient for both dietary silicon monitoring (where values of interest run from single-digit mg/100g in fresh produce to several hundred mg/kg in cereals) and purity verification of food-grade SiO2 inputs.
Sample preparation is where most laboratory errors occur. Accurate total silicon determination in food matrices — especially high-starch cereals or high-fat ingredients — requires microwave-assisted acid digestion using 5 mL concentrated HNO3 plus 1 mL HF at 200°C. The HF step dissolves silicate structures that resist nitric acid alone, but it demands platinum or PFA digestion vessels and strict personnel protection protocols; PTFE vessels degrade under repeated HF exposure and introduce measurement error within months of deployment. Germanium at 1 mg/L serves as the internal standard, correcting for plasma fluctuations and matrix suppression effects that are pronounced in high-organic-load samples. Calibration should span 0.5–50 mg/L using matrix-matched standards — aqueous-only calibration systematically underestimates silicon in fatty or high-starch digests by 8–15%, a well-documented interference that invalidates compliance decisions if ignored.
For rapid at-line or incoming QC of aqueous streams — mineral water, beverage ingredients, or liquid silica sols — the colorimetric molybdenum blue method is practical and cost-effective. Its working range of 0.1–10 mg/L covers typical dissolved silicon concentrations in water and beverage matrices without the capital cost or safety infrastructure of ICP-OES. It is not appropriate for solid or polymeric materials, and it measures only dissolved monomeric orthosilicic acid, not total silicon.
Specification Language for Food-Grade SiO2 Anti-Caking Agents
A purchase specification that reads only “food-grade silicon dioxide” is commercially useless and creates audit liability. The Food Chemicals Codex (FCC) monograph provides the regulatory floor, but procurement should translate it into numbered, measurable limits that a supplier’s Certificate of Analysis can be directly cross-referenced against.
Minimum specification parameters should include: purity ≥99.0% SiO2 by XRF; BET surface area within the range of 100–400 m²/g for fumed grades or 50–800 m²/g for precipitated grades (with the target sub-range confirmed against the intended application — higher surface area improves anti-caking efficacy but increases cost and can affect bulk density in dry blends); total heavy metals <10 ppm; arsenic <3 ppm; lead Procurement warning: EFSA’s ongoing re-evaluation of E551 silicon dioxide (initiated 2018) specifically examines the nanoparticle fraction present in fumed-grade SiO2. Suppliers should be required to provide particle size distribution data — not just BET surface area — so procurement teams can assess exposure to the <100 nm fraction as that regulatory assessment concludes. Specifications written today should include a clause reserving the right to revise limits in response to the EFSA outcome.
Food-Contact Silicone Supplier Audit Checklist
Food-contact silicone components — gaskets, tubing, conveyor belts, baking molds — enter food production at points where the relevant compliance standard shifts from food additive regulation to food-contact material law. The audit checklist is different, and procurement teams that conflate the two frameworks create systematic compliance gaps.
A complete supplier qualification audit for food-contact silicone should confirm: (1) polymer backbone type and crosslinker identity in writing — addition-cured platinum systems and peroxide-cured systems carry different migration profiles and require different simulant testing; (2) migration test data per EU Regulation 10/2011, conducted at 40°C for 10 days in simulants A (10% ethanol), B (3% acetic acid), C (20% ethanol), and D2 (vegetable oil) where contact conditions warrant; (3) a Certificate of Compliance referencing FDA 21 CFR 177.2600 for any product entering US-market supply chains; and (4) analytical confirmation that restricted cyclosiloxanes D4, D5, and D6 are each below 0.1% w/w per REACH SVHC requirements — this limit applies to leave-on cosmetics by regulation but is increasingly adopted as a food-contact benchmark by major retailers and OEMs conducting life-cycle risk assessments.
In a typical three-shift food processing operation running continuous hot-fill lines, silicone pump diaphragms and gaskets are replaced on a calendar schedule rather than based on migration testing. What often goes undetected is that a supplier substitution mid-contract — same part number, different compound formulation — resets the migration performance baseline without triggering any incoming inspection. Specifying that any change in compound formulation requires requalification testing, not just re-approval of dimensional drawings, closes that gap.
Food-grade silicon dioxide (E551) is chemically inert and requires no toxicological monitoring beyond standard food additive approvalFalse
EFSA's 2018-initiated re-evaluation specifically targets the nanoparticle fraction of fumed SiO2, which may have different bioavailability and toxicological characteristics than bulk amorphous silica. Procurement specifications should track regulatory developments and request particle size distribution data from suppliers as the assessment progresses.
KPI Benchmarks and QC Specification Table
For ongoing supplier performance management, meaningful KPIs for silicon chemical procurement include: on-time delivery rate ≥98%; batch-to-batch SiO2 purity coefficient of variation <0.3%; heavy metal compliance 100% of incoming lots; supplier quality system certification to both ISO 9001 and ISO 22000; and process capability index (Cpk) ≥1.33 for all critical specification parameters — surface area, moisture content, and pH — across a minimum rolling 20-batch window. A Cpk of 1.33 represents the minimum that sustains Six Sigma-level process control and should be a contractual requirement, not an aspirational target.
| Parameter | Specification Limit | Test Method | Consequence of Non-Compliance | Audit Frequency |
|---|---|---|---|---|
| SiO2 purity | ≥99.0% w/w | XRF or gravimetric | Reduced active surface; formulary dose recalculation required | Every lot |
| BET surface area (fumed grade) | 150–300 m²/g (application-specific range) | BET nitrogen adsorption (ISO 9277) | 400 m²/g: bulk density problems, dustiness | Every lot |
| Total heavy metals | <10 ppm total; As <3 ppm; Pb <5 ppm | ICP-OES or ICP-MS | Regulatory non-compliance; batch rejection; potential market withdrawal | Every lot |
| Moisture content | ≤7% (LOD at 105°C) | Gravimetric (LOD) | Agglomeration in blend; rework cost $50–200/MT; caking on filling equipment | Every lot |
| pH (4% slurry) | 3.5–7.5 | Potentiometric | pH 7.5: interaction with acid-sensitive active ingredients | Every lot |
| Migration limit (food-contact silicone) | ≤10 mg/dm² overall migration | EU 10/2011 simulants A–D, 40°C/10 days | Non-compliance triggers batch hold, customer notification, potential recall | New supplier; compound change; annual requalification |
The migration limit row in the table carries a different operational logic than the others: it is not a routine incoming test — it is a qualification gate. Procurement teams that treat it as a one-time approval and then allow compound or supplier substitutions without retesting are operating on expired data.
Hidden Cost Analysis: What Happens When Silicon Content Is Ignored in Food Formulation and Industrial Supply Decisions
Silicon specification failures almost never announce themselves at launch. They surface six months later as a regulatory letter, a caking complaint from a distributor, or a migration test failure that triggers a customs hold — by which point the remediation cost dwarfs whatever the original specification review would have cost. The pattern is consistent: the problem was present from day one, but the signal was quiet.
Nutraceutical Label Claims Built on the Wrong Silicon Form
A bone-health supplement claiming “10 mg bioavailable silicon per serving” is a compliance asset — until the formulator used phytolithic silica to hit the label number. Phytolithic silica bioavailability runs below 5%, meaning actual delivered orthosilicic acid at the tissue level is closer to 0.5 mg per serving. That is not a rounding error; it is a 20-fold shortfall against the stated claim.
Under FTC substantiation requirements, a health claim must be supported by competent and reliable scientific evidence for the form and dose actually delivered, not the total elemental content in the capsule. EFSA’s Article 13 framework applies the same logic: the health effect must be demonstrated for the specific form. A product built on phytolithic silica cannot legitimately borrow clinical evidence generated with choline-stabilized OSA. When this discrepancy surfaces — through a competitor complaint, an NGO audit, or a regulatory sweep — recall and reformulation costs for a mid-scale brand commonly run $500,000 to $5 million, depending on distribution reach and inventory depth.
Total silicon content on a supplement label is equivalent to bioavailable silicon doseFalse
Bioavailability varies from less than 5% for phytolithic silica to roughly 50% for orthosilicic acid forms. Label content figures for silicon do not translate to physiological dose without specifying the silicon compound and its confirmed bioavailability fraction.
Anti-Caking Failures in Spice and Dry-Blend Manufacturing
Fumed silica used as an anti-caking agent must meet a specific BET surface area range — typically 150–300 m²/g for food-grade applications — to perform reliably at working addition levels (0.5–2% by weight). A procurement decision that substitutes a lower-specification precipitated silica or accepts a fumed grade with inconsistent surface area can appear invisible until relative humidity in the warehouse exceeds 60%, at which point hygroscopic spice blends begin bridging in the bag within days.
In a typical high-throughput spice facility running three shifts, a single production line shutdown triggered by bulk caking in the dosing hoppers costs $15,000–$50,000 per day in lost throughput, plus quality remediation, rework labor, and potential customer-side deduction claims. The compounding problem: operators often compensate by increasing anti-caking additive levels beyond validated ranges, which then pushes the formulation toward the E551 maximum use level of 10,000 mg/kg and creates a secondary compliance exposure.
Quick verdict: Specify BET surface area, moisture content, and bulk density for every fumed silica purchase order — not just “food-grade SiO2.”
Silicon Variability in Functional Beer and Hop-Forward Categories
Breweries entering the functional beverage space with silicon-content positioning face a batch consistency problem that has no easy workaround. Hop variety and malt source variability alone can drive ±30% silicon content variation between production batches, with IPA-style beers ranging from 6 to 39 mg Si/L depending on raw material origin. A brewery that establishes a label claim based on a single ICP-OES test during product development, then switches malt suppliers for cost reasons mid-production, may find subsequent batches fall materially below the stated value — creating exactly the substantiation gap described above.
The fix is straightforward in principle but operationally demanding: incoming raw material testing against a silicon specification range, not just a supplier certificate of conformance, with ICP-OES verification at 251.6 nm across a minimum of three sequential batches before locking a label claim.
Food-Contact Silicone Migration: The Visually Identical Problem
Non-food-grade silicone tubing, gaskets, and baking molds are frequently indistinguishable from compliant materials by visual inspection or even basic shore hardness testing. The difference lies in the curing system, filler grade, and the presence or absence of restricted substances. Using industrial-grade silicone in a food processing environment — a substitution that happens most often during a maintenance emergency when certified stock is unavailable — can cause prohibited substance migration that exceeds EU Regulation 10/2011 limits under standard testing conditions (40°C, 10 days, simulants A through D).
In EU food manufacturing, the average cost of a product contamination recall triggered by migration failure runs approximately €1.2 million per incident when distribution, logistics, consumer communications, and regulatory response are accounted for. The “temporary” maintenance fix that becomes permanent is the dominant failure pathway here. A non-compliant gasket installed on a Friday night to keep the line running is still in service at the next scheduled audit.
Operational warning: Maintain a segregated, labeled inventory of food-contact-certified silicone consumables. A single non-compliant substitution during unplanned maintenance is the most common trigger for food-contact migration failures — and the equipment looks identical before and after.
Fortification Over-Correction and the Reformulation Cycle
Adding synthetic SiO2 as a silicon fortification vehicle without bioavailability-adjusted dosing creates a different regulatory exposure: exceeding the E551 maximum use level of 10,000 mg/kg in the finished product category. This happens when formulators stack anti-caking and fortification functions using the same SiO2 ingredient without tracking cumulative addition levels across the full formulation matrix.
When the overage is detected — typically at a market surveillance sampling event or during a formula audit for a private-label retailer — the result is mandatory reformulation, label revision, and re-registration across every affected SKU. For a mid-size food company, that cycle costs $80,000–$300,000 per SKU when regulatory submission, production changeover, artwork revision, and inventory write-off are aggregated. None of this cost appears in the original formulation budget. All of it traces back to a specification decision made without complete silicon accounting across the ingredient stack.
Frequently Asked Questions: Shop-Floor and Procurement-Desk Questions About Silicon in Foods and Industrial Silicon Chemistry
Is the silicon in food the same as industrial silicon used in chemicals and electronics?
No — and confusing them is the fastest way to misread a supplier COA or misframe a nutrition label claim. Food silicon exists as orthosilicic acid [Si(OH)₄], the soluble monomeric form absorbed across the gut wall, or as amorphous phytolithic silica (SiO₂·nH₂O), the biogenic mineral deposited in plant cell walls. Industrial silicon metal (Si⁰) is a smelted, reduced metallurgical or electronic-grade material. Organosilicon compounds — silicones, silanes, siloxanes — are synthesized via the Müller-Rochow process or downstream chemistry and are not naturally present in any food matrix. The atomic number (14) is shared; the chemistry, bioavailability, toxicological profile, and regulatory classification are entirely distinct. A fumed silica (E551) supplier and a whole-grain oat miller are both dealing with silicon — but they are not dealing with the same thing, and no amount of elemental analysis conflates them.
Does mineral water actually contribute meaningfully to daily silicon intake?
Yes, if the source geology is right. Waters drawn from volcanic basalt or granite aquifer systems commonly contain 20–35 mg Si/L as dissolved orthosilicic acid — the same bioavailable form found in beer. At 1.5 L/day consumption, that delivers 30–52 mg Si/day, meeting or exceeding most estimated adequate intake figures in a single beverage source. Standard municipal tap water typically runs 1–5 mg Si/L, contributing only 1.5–7.5 mg/day — a real but modest contribution. The practical point for food technologists formulating silicon-fortified beverages: the OSA polymerization threshold sits above pH 7–8 or concentrations above roughly 2 mM, so stability testing at formulation pH is non-negotiable before any enrichment claim goes on packaging.
How do I specify food-grade silicon dioxide for an anti-caking application versus a nutraceutical flow-agent application?
These are not interchangeable specifications, even though both use E551 silicon dioxide. For anti-caking in food powders — dried spice blends, powdered dairy, instant beverage mixes — specify fumed silica with BET surface area 150–300 m²/g, moisture ≤5%, purity ≥99.0% SiO₂, and full E551 or FCC compliance with heavy metal limits documentation. The high surface area drives adsorption of surface moisture that causes bridging and caking.
For nutraceutical capsule filling and tablet compression, precipitated silica at a lower BET range (50–150 m²/g) is often preferred — the lower surface area improves powder compressibility and reduces the abrasive wear on punch tooling that fumed grades can accelerate. Both grades must carry FCC or EU E551 certification. In a typical nutraceutical contract-manufacturing operation handling 20–30 SKUs, it is surprisingly common to find a single “generic food-grade silica” spec used across all applications — the anti-caking grade causing flow problems in tablet compression, and the compressible grade underperforming in moisture-sensitive powder sachets. Specify application by application.
Food-grade silicon dioxide (E551) and nutritional silica supplements are chemically identical compoundsFalse
Although both are amorphous SiO₂, food-grade E551 (primarily fumed or precipitated silica used as a processing aid) and nutraceutical orthosilicic acid or choline-stabilized OSA are different forms with different bioavailabilities — E551 silica is largely non-bioavailable, while OSA is the absorbable monomeric form.
Can cooking methods preserve silicon in vegetables?
Yes — method matters more than most food preparation guides acknowledge. Steaming retains roughly 75–85% of silicon relative to raw, while boiling in excess water drops retention to 60–70% as orthosilicic acid leaches into the cooking water. Microwaving with minimal added water performs best at 80–90% retention. Roasting concentrates silicon on a dry-weight basis as moisture is driven off. One practical recovery measure food technologists often overlook: the cooking water from high-silicon vegetables — green beans, leeks, celery — carries meaningful dissolved OSA and can be reincorporated into stocks, sauces, or soup bases rather than discarded down the drain.
What certifications should I require from a Chinese organosilicon supplier for food-contact silicone polymers?

At minimum, your approved-supplier checklist should include: ISO 9001:2015; ISO 22000:2018 or FSSC 22000 for food safety management systems; GB 4806.11-2016 (China’s food-contact silicone standard); a written FDA 21 CFR 177.2600 letter of conformance; EU Regulation 10/2011 migration test reports covering simulants A through D at 40°C/10 days; and a REACH SVHC declaration specifically addressing cyclosiloxanes D4, D5, and D6 at the 0.1% w/w threshold. Beyond the document package, request batch-specific COAs with viscosity measurement, vinyl content for crosslinked grades, and platinum catalyst residue data — platinum residuals above specification are a recurring compliance issue in lower-cost silicone supply and one that is rarely caught without explicit incoming QC testing. Any supplier unable to provide batch-traceable platinum data on demand should be treated as a qualification risk regardless of price advantage.
Is there a measurable performance difference between silicon-rich and silicon-poor diets for athletes or aging populations?
The epidemiological evidence is consistent. The Framingham Osteoporosis Study (2004) found that individuals in the upper quartile of dietary silicon intake (above roughly 40 mg/day) had significantly higher hip and lumbar spine bone mineral density compared to the lowest quartile. The EPIC-Oxford cohort data shows similar directional associations. For clinical intervention evidence, Spector et al. (2008) conducted a double-blind 12-week trial using choline-stabilized orthosilicic acid (ch-OSA) at 10 mg Si/day and found statistically significant improvements in collagen synthesis biomarkers — this remains the strongest controlled evidence for supplementation efficacy. Athletic performance RCTs specifically are sparse, and extrapolating bone density associations to acute performance outcomes oversteps the current evidence base. For claims work, the collagen synthesis pathway is the defensible clinical anchor.
How do I verify silicon content in an incoming raw material shipment of whole-grain flour or oat bran?
Use ICP-OES after microwave acid digestion in an HNO₃/HF mixture — ICP-OES at the 251.6 nm silicon wavelength achieves detection limits around 0.01 mg/kg in food matrices, well below the concentrations you are measuring. Expected total silicon for whole-oat bran is 400–700 mg Si/kg dry weight; whole-wheat flour should read 80–150 mg Si/kg. White flour from the same wheat will retain only about 15% of that — roughly 12–22 mg Si/kg — because silicon concentrates in the bran fraction. A shipment of “whole-grain oat flour” reading below 200 mg Si/kg should trigger a hold and specification review: it suggests significant bran removal, blending with refined fractions, or substitution with a lower-grade input. Establish statistical process control charts with ±20% acceptance limits around your verified historical mean, and run a Cpk assessment at first qualification — Cpk ≥1.33 is the appropriate minimum target for critical nutritional specification parameters in food-grade ingredient supply.
Strategic Sourcing Implications: How Understanding Dietary Silicon Science Strengthens Industrial Organosilicon Procurement Decisions
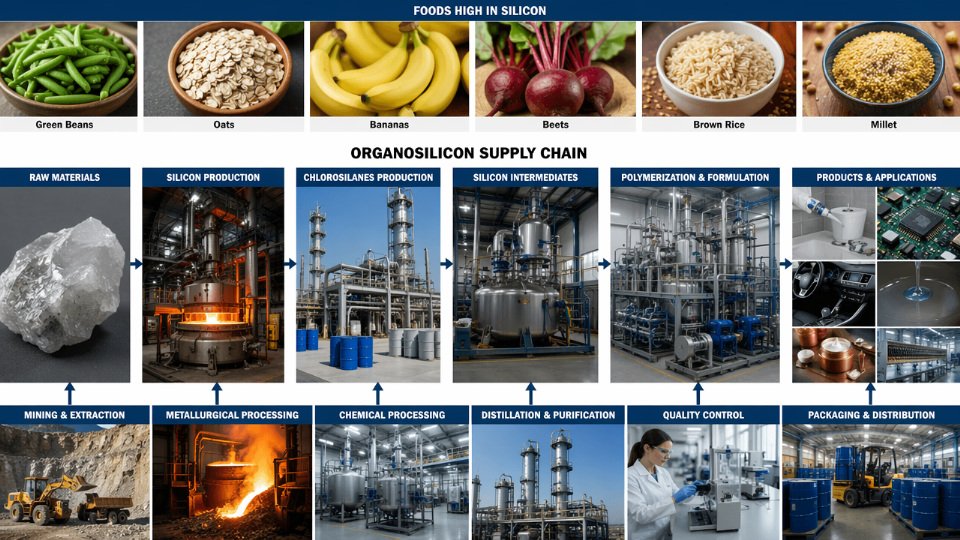
The nutritional science thread running through this article terminates, ultimately, at a chemical plant. Every milligram of orthosilicic acid absorbed from a glass of beer, every gram of E551 anti-caking agent keeping a powdered infant formula free-flowing, every food-contact silicone gasket sealing a dairy processing line — all of it traces back to the same upstream chemistry: purified silicon metal reduced from quartz, converted to trichlorosilane, and polymerized into polydimethylsiloxane base polymers or fumed silica in large-scale integrated organosilicon facilities. Understanding what silicon does in food systems is inseparable from understanding where that silicon comes from and how reliably it can be supplied.
The Upstream Chemistry Behind Every Food-Grade Silicon Specification
When a food technologist specifies fumed silica (E551) at a BET surface area of 150–300 m²/g for a dry seasoning blend, or a nutraceutical formulator selects choline-stabilized orthosilicic acid for a bone-health supplement, the critical quality parameters they care about — particle morphology, surface chemistry, cyclosiloxane residuals, heavy metal limits — are locked in at the precursor chemistry stage, not at the blending step. A fumed silica with inconsistent surface area from lot to lot will produce variable flowability in dry mixes; a PDMS defoamer with uncontrolled D4/D5/D6 cyclosiloxane content creates regulatory exposure across multiple markets simultaneously, since REACH SVHC restrictions on cyclosiloxanes above 0.1% w/w now overlap with food-contact compliance reviews in several jurisdictions.
This means procurement decisions made at the commodity level — choosing a PDMS base polymer supplier, or a fumed silica precursor source — directly determine whether a food or nutraceutical product can clear regulatory review in the EU, US, and China simultaneously.
China’s Integrated Organosilicon Cluster: What the Cost Advantage Actually Reflects
China’s Zhejiang and Jiangxi production clusters, anchored by integrated producers with full silicon metal-to-polymer vertical capability, supply the majority of global PDMS and fumed silica precursor volume. The 15–25% per-MT cost advantage over Western equivalents for comparable-grade materials is real — but it is not explained by lower quality standards. It reflects economies of scale in chlorosilane distillation, co-product integration across siloxane streams, and geographic proximity to both silicon metal smelters and downstream polymer finishing operations. Suppliers with this integration level can maintain tighter lot-to-lot purity consistency precisely because they are not blending outputs from disconnected toll manufacturers.
In a typical food-ingredient supply scenario, a European flavour house reformulating a spray-dried emulsion blend will specify E551 at ≥99.5% SiO2, maximum 10 ppm heavy metals, and a D4+D5 cyclosiloxane limit of <1 ppm in extraction. Sourcing from a non-integrated supplier — one purchasing fumed silica precursor externally and performing surface treatment independently — routinely produces wider lot-to-lot BET surface area variation (±30 m²/g vs. ±10 m²/g in integrated production), which shows up not as a failed incoming QC test but as intermittent caking complaints from the customer’s filling line six weeks after delivery. By the time the root cause is traced, two production runs are compromised.
Fumed silica (E551) from Chinese producers cannot meet EU food-grade purity specificationsFalse
Integrated Chinese organosilicon producers operating with food- and pharma-grade quality systems routinely meet EU Regulation 1333/2008 purity requirements, including heavy metal limits and cyclosiloxane controls, when full vertical integration and ICP-OES/GC-MS in-house analytical capability are in place. Grade selection and supplier audit matter far more than country of origin.
Supplier Evaluation: What Food-Tech Organosilicon Procurement Actually Requires
Analytical turnaround time is underrated as a procurement criterion. Suppliers with in-house ICP-OES (silicon at 251.6 nm detection), GC-MS for cyclosiloxane quantification, and rheology testing can issue a complete COA within 24–48 hours of batch release. Suppliers relying on outsourced third-party labs commonly return COAs in 5–7 days — which sounds manageable until a food manufacturer is holding a production slot against a confirmed delivery and the ingredient is in quarantine pending documentation. In regulated food categories, the cost of a held production run frequently exceeds the cost difference between a premium-service supplier and a cheaper alternative.
Regulatory continuity support is equally undervalued. EFSA’s ongoing re-evaluation of E551 initiated in 2018 — specifically examining the nanoparticle fraction of fumed silica — will eventually produce updated documentation requirements. FDA GRAS status updates and China’s GB 4806.11-2016 revision cycle add further layers. Suppliers who actively track these regulatory cycles and provide pre-formatted technical dossier support reduce total compliance cost by an estimated 20–35% versus managing documentation updates across a fragmented multi-supplier base. For a procurement team without a dedicated regulatory affairs headcount, that difference is the difference between a smooth re-registration and a product launch delay.
| Evaluation Criterion | Best-in-Class Benchmark | Consequence of Shortfall |
|---|---|---|
| Purity consistency (SiO2 or PDMS polymer grade) | Cpk ≥1.33 on critical parameters, lot-to-lot BET ±10 m²/g | Intermittent process instability; caking, foaming, or migration failures traced back to ingredient weeks after delivery |
| Regulatory documentation | Full food-grade COA with ICP-OES, GC-MS cyclosiloxane, and migration data; updated within 30 days of standard revision | Customs holds, delayed EU/FDA/China re-registration, unplanned reformulation cost |
| COA lead time | 24–48 hours from in-house analytical lab | Production scheduling conflicts; quarantine costs on time-sensitive ingredients |
| Vertical integration depth | Silicon metal → chlorosilane → polymer/fumed silica in single production cluster | Wider purity variance; limited traceability on contamination root cause |
| Cyclosiloxane control (D4/D5/D6) | <1 ppm in food-grade PDMS and fumed silica; GC-MS method validated | REACH/food-contact compliance failure across EU and emerging-market equivalents |
| Regulatory update support | Active monitoring of EFSA E551 re-evaluation, FDA 21 CFR updates, GB standard revisions | 20–35% higher total compliance management cost; reactive reformulation risk |
The Full Spectrum: From Plant Cell Wall to Industrial Supply Chain
Silicon’s path from barley husk to bone matrix to anti-caking agent to food-contact gasket material is not a metaphor — it is a literal supply chain. The orthosilicic acid a nutritionist measures in a serving of mineral water and the fumed silica a process engineer specifies for a dry premix share the same elemental origin and, ultimately, the same upstream production infrastructure. Companies operating across food, nutraceutical, and specialty chemical markets benefit from supply chain partners who understand both ends of that spectrum: the biological mechanisms that make silicon specification meaningful in food science, and the organosilicon manufacturing discipline that makes consistent, regulatory-compliant delivery possible at scale.
That breadth of technical understanding — from dietary bioavailability data to chlorosilane distillation column design — is what separates a commodity silicon chemical supplier from a long-term strategic partner for food-tech and nutraceutical procurement.